Temperature

I would be interested too! Some month ago I was plagued with a lot of "strange" VM behaviours, broken boots, clones unable to boot, whatever. After a lot of struggling I've found that the CPU fan was melted and so as soon as CPU temperature raised, all evil thing happened. If I only had a CPU temperature alert in the dashboard...
 
apt install xsensors then run with sensors

you can write a little script to alert you via email if its over a certain degree. i leave this as an exercise to the reader ;)
 
apt install xsensors then run with sensors

you can write a little script to alert you via email if its over a certain degree. i leave this as an exercise to the reader ;)
Thanks for this tool :)
I've installed on my Proxmox Server it's exactly than i want
 
to add the feature we first need to rework pvestatd, so i'm guessing this might take a while.

for now your best solution would be using a monitoring software like zabbix

I am interested in doing something like this. Few questions:
  1. When you propose this, you mean to install it as a VM or IN the server itself?
  2. If the previous answer is in a VM, it still monitors the Proxmox (physical hardware)?
  3. If the answer to question 1 is in the server itself: will it also monitor your VMs and Containers?
Thanks in advance.
 
For Zabbix you need a Zabbix server somewhere (I'm running a debian VM with 1 vCPU, 2.5 GiB RAM and 64 GiB storage for that) and the zabbix agent that needs to be installed directly on your PVE host. But keep in mind that Zabbix writes a lot. All the metrics need to be stored in a DB doing sync writes which causes alot of write amplification. Here on the homeserver Zabbix it is writing maybe 200 GB per day to the SSDs just for monitoring around 30 VMs/LXC/hosts. So thats a bit overkill if you just want to monitor the temperature of your PVE host and don't care about monitoring other metrics or hosts/guests too.
 
Last edited:
For Zabbix you need a Zabbix server somewhere (I'm running a debian VM with 1 vCPU, 2.5 GiB RAM and 64 GiB storage for that) and the zabbix agent that needs to be installed directly on your PVE host. But keep in mind that Zabbix writes a lot. All the metrics need to be stored in a DB doing sync writes which causes alot of write amplification. Here on the homeserver Zabbix it is writing maybe 200 GB per day to the SSDs just for monitoring around 30 VMs/LXC/hosts. So thats a bit overkill if you just want to monitor the temperature of your PVE host and don't care about monitoring other metrics or hosts/guests too.
Thank you!

I want to run it to monitor my PVE server, a couple of Containers and a couple of VMs and 2 remote servers (hosted on AWS).

Do you think will require a lot of disk and IO on that scenario?
 
apt install xsensors then run with sensors

you can write a little script to alert you via email if its over a certain degree. i leave this as an exercise to the reader ;)
Are there any guides to setting up such an alert you are aware of?
 
Are there any guides to setting up such an alert you are aware of?
You can create a cronjob that runs a bash script which checks if something is over a certain temperature and calls back to a slack webhook:

Bash:
#! /bin/bash

# ©locknessKo 2022

# Slack incoming webhook URL
slack_url=https://hooks.slack.com/services/xxx/xxx/xxx

# Threshold for when to send alert
threshold=80

sensors | grep -e "temp1" | while read line; do
        temp=$(echo $line | awk -F "+" '{ print $2 }' | awk -F "." '{ print $1 }');
        if (( temp > $threshold )); then
                curl -X POST -H 'Content-type: application/json' --data "{'text':'ALERT for $(hostname). Temperature is $temp degrees'}" $slack_url;
        fi;
        done

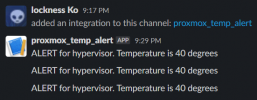
The above code produces an output like this:
1642847580675.png

A guide on how to setup slack incoming webhook: https://api.slack.com/messaging/webhooks

How to use cronjobs: https://www.cyberciti.biz/faq/how-do-i-add-jobs-to-cron-under-linux-or-unix-oses/

Hope this helps!
 
Here's a page showing how to hack CPU temperature (from lm-sensors) into the text at the top of the node summary page. Work isn't my own, but I've confirmed it works on PVE 7.1. Would be nice to have a graph, or some kind of flashing alarm when it exceeds threshold, but at least this puts it somewhere that I *might* notice.

https://www.programmerall.com/article/5981210525/
 
Last edited:
So Epyc cpu's work but they are not called core 0,1,2,3....
Its Tctl,Tdie,Tccd1,3,5....
So I made an adjustment to the JS to replace Tctl with core 0 so I can use it on my cluster of amd and intel systems.

JavaScript:
    {
        itemId: 'thermal',
        colspan: 2,
            printBar: false,
            title: gettext('CPU temperature'),
            textField: 'thermalstate',
            renderer:function(value){
            var c0val = value.replace("Tctl","Core 0");
            var c0 = c0val.match(/Core 0.*?\+([\d\.]+)?/)[1];
        return `CPU Temp: ${c0}`
       }     
    }
 
Hey just a question does anyone know how to modify the script for a dual socket cpus, as follows for the hack and may be throuw in the gpu in loc1

{
itemId: 'thermal',
colspan: 2,
printBar: false,
title: gettext('CPU temperature'),
textField: 'thermalstate',
renderer:function(value){
const c0 = value.match(/Core 0.*?\+([\d\.]+)?/)[1];
const c1 = value.match(/Core 1.*?\+([\d\.]+)?/)[1];
const c2 = value.match(/Core 2.*?\+([\d\.]+)?/)[1];
const c3 = value.match(/Core 3.*?\+([\d\.]+)?/)[1];
const c4 = value.match(/Core 4.*?\+([\d\.]+)?/)[1];
const c8 = value.match(/Core 8.*?\+([\d\.]+)?/)[1];
const c9 = value.match(/Core 9.*?\+([\d\.]+)?/)[1];
const c10 = value.match(/Core 10.*?\+([\d\.]+)?/)[1];
const c11 = value.match(/Core 11.*?\+([\d\.]+)?/)[1];
const c12 = value.match(/Core 12.*?\+([\d\.]+)?/)[1];
return `Core: ${c0} | ${c1} | ${c2} | ${c3} | ${c4} | ${c8} | ${c9} | ${c10} | ${c11} | ${c12}`
}
}

This has two package ids reading from sensors command
coretemp-isa-0001
Adapter: ISA adapter
Package id 1: +42.0°C (high = +85.0°C, crit = +95.0°C)
Core 0: +37.0°C (high = +85.0°C, crit = +95.0°C)
Core 1: +39.0°C (high = +85.0°C, crit = +95.0°C)
Core 2: +42.0°C (high = +85.0°C, crit = +95.0°C)
Core 3: +34.0°C (high = +85.0°C, crit = +95.0°C)
Core 4: +34.0°C (high = +85.0°C, crit = +95.0°C)
Core 8: +37.0°C (high = +85.0°C, crit = +95.0°C)
Core 9: +38.0°C (high = +85.0°C, crit = +95.0°C)
Core 10: +35.0°C (high = +85.0°C, crit = +95.0°C)
Core 11: +36.0°C (high = +85.0°C, crit = +95.0°C)
Core 12: +36.0°C (high = +85.0°C, crit = +95.0°C)

nvme-pci-4400
Adapter: PCI adapter
Composite: +30.9°C (low = -273.1°C, high = +80.8°C)
(crit = +81.8°C)
Sensor 1: +30.9°C (low = -273.1°C, high = +65261.8°C)
Sensor 2: +33.9°C (low = -273.1°C, high = +65261.8°C)

coretemp-isa-0000
Adapter: ISA adapter
Package id 0: +42.0°C (high = +85.0°C, crit = +95.0°C)
Core 0: +39.0°C (high = +85.0°C, crit = +95.0°C)
Core 1: +42.0°C (high = +85.0°C, crit = +95.0°C)
Core 2: +35.0°C (high = +85.0°C, crit = +95.0°C)
Core 3: +35.0°C (high = +85.0°C, crit = +95.0°C)
Core 4: +39.0°C (high = +85.0°C, crit = +95.0°C)
Core 8: +38.0°C (high = +85.0°C, crit = +95.0°C)
Core 9: +41.0°C (high = +85.0°C, crit = +95.0°C)
Core 10: +42.0°C (high = +85.0°C, crit = +95.0°C)
Core 11: +39.0°C (high = +85.0°C, crit = +95.0°C)
Core 12: +41.0°C (high = +85.0°C, crit = +95.0°C)

i350bb-pci-0103
Adapter: PCI adapter
loc1: +66.0°C (high = +120.0°C, crit = +110.0°C)
 
Any luck yet in getting thermal sensors passthrough host ? rework on pvestatd ?
Email alerts aren't an option right now.
It would be great if this worked and had a working thermal sensor widget on the pfsense dashboard.
 
You can create a cronjob that runs a bash script which checks if something is over a certain temperature and calls back to a slack webhook:

Bash:
#! /bin/bash

# ©locknessKo 2022

# Slack incoming webhook URL
slack_url=https://hooks.slack.com/services/xxx/xxx/xxx

# Threshold for when to send alert
threshold=80

sensors | grep -e "temp1" | while read line; do
        temp=$(echo $line | awk -F "+" '{ print $2 }' | awk -F "." '{ print $1 }');
        if (( temp > $threshold )); then
                curl -X POST -H 'Content-type: application/json' --data "{'text':'ALERT for $(hostname). Temperature is $temp degrees'}" $slack_url;
        fi;
        done

The above code produces an output like this:
View attachment 33545

A guide on how to setup slack incoming webhook: https://api.slack.com/messaging/webhooks

How to use cronjobs: https://www.cyberciti.biz/faq/how-do-i-add-jobs-to-cron-under-linux-or-unix-oses/

Hope this helps!

Thanks for this awesome script. I've got it working but I've never used slack before. Is there some way to redirect the alerts via some sort of notification to an email address when the messages are posted in slack?

Edit: figured it out, thanks again for this script
 
Last edited:

About

The Proxmox community has been around for many years and offers help and support for Proxmox VE, Proxmox Backup Server, and Proxmox Mail Gateway.
We think our community is one of the best thanks to people like you!

Get your subscription!

The Proxmox team works very hard to make sure you are running the best software and getting stable updates and security enhancements, as well as quick enterprise support. Tens of thousands of happy customers have a Proxmox subscription. Get yours easily in our online shop.

Buy now!