Strange disk behaviour

lifeboy

Renowned Member
We're experiencing a problem with a FreeBSD KVM guest that works 100% on installation, but after a while starts complaining that it can't write to the disk anymore. What we have done so far:
  1. Moved the disk image off ceph to a lvm-thin volume
  2. Changed the disk from Virtio-SCSI to SATA and also IDE as a test
  3. Tried various disk options (SSD emulation on/off, discard on/off, async_io changes)
None of these make any difference.

Then I noticed that the stage indicator on the GUI of proxmox shows 139.59GB storage used by a disk that is set to 130GB.
1700472159653.png

Inside the guest there is ample space.

Code:
[iris@simba.xxxxxx /usr/local/iris]$ df -h
Filesystem        Size    Used   Avail Capacity  Mounted on
/dev/gpt/data0    110G     62G     39G    62%    /
devfs             1.0K    1.0K      0B   100%    /dev
[iris@simba.xxxxxx /usr/local/iris]$

The volume itself:

Code:
# lvdisplay /dev/pve/vm-199-disk-0
  --- Logical volume ---
  LV Path                /dev/pve/vm-199-disk-0
  LV Name                vm-199-disk-0
  VG Name                pve
  LV UUID                eQjtqp-fRIm-t4cP-rbiL-3mzQ-Gvy0-AkHEUA
  LV Write Access        read/write
  LV Creation host, time FT1-NodeD, 2023-09-14 14:03:04 +0200
  LV Pool name           data
  LV Status              available
  # open                 0
  LV Size                130.00 GiB
  Mapped size            84.29%
  Current LE             33280
  Segments               1
  Allocation             inherit
  Read ahead sectors     auto
  - currently set to     256
  Block device           253:20

What is going on here? Something doesn't add up....
 
We're experiencing a problem with a FreeBSD KVM guest that works 100% on installation, but after a while starts complaining that it can't write to the disk anymore. What we have done so far:
  1. Moved the disk image off ceph to a lvm-thin volume
  2. Changed the disk from Virtio-SCSI to SATA and also IDE as a test
  3. Tried various disk options (SSD emulation on/off, discard on/off, async_io changes)
None of these make any difference.

Then I noticed that the stage indicator on the GUI of proxmox shows 139.59GB storage used by a disk that is set to 130GB.
View attachment 58404

Inside the guest there is ample space.

Code:
[iris@simba.xxxxxx /usr/local/iris]$ df -h
Filesystem        Size    Used   Avail Capacity  Mounted on
/dev/gpt/data0    110G     62G     39G    62%    /
devfs             1.0K    1.0K      0B   100%    /dev
[iris@simba.xxxxxx /usr/local/iris]$

The volume itself:

Code:
# lvdisplay /dev/pve/vm-199-disk-0
  --- Logical volume ---
  LV Path                /dev/pve/vm-199-disk-0
  LV Name                vm-199-disk-0
  VG Name                pve
  LV UUID                eQjtqp-fRIm-t4cP-rbiL-3mzQ-Gvy0-AkHEUA
  LV Write Access        read/write
  LV Creation host, time FT1-NodeD, 2023-09-14 14:03:04 +0200
  LV Pool name           data
  LV Status              available
  # open                 0
  LV Size                130.00 GiB
  Mapped size            84.29%
  Current LE             33280
  Segments               1
  Allocation             inherit
  Read ahead sectors     auto
  - currently set to     256
  Block device           253:20

What is going on here? Something doesn't add up....
Hi,
please check the size as indicated in the VM config, qm config <VMID>. How did you move the disk from ceph to lvm-thin, was this done via the WebUI? What is the exact error message you get inside the VM. Also double check the partitions on the disk regarding size and run an fsck of the filesystem inside the VM.
The vm config shows 130GB allocation for the disk.

Code:
sata0: speedy:vm-199-disk-0,discard=on,size=130G,ssd=1

The guest is FreeBSD, fsck has been run very often, that's not the issue.

The problem is that the processes are running into a "D" state (waiting on disk). Eventually nothing runs on the machine anymore, everything is waiting on disk (of the processes that write to disk)

When the VM is reinstalled from scratch everything runs just fine, until as some point weeks or months after that, the problem re-occurs.

In the original post the disk allocation in the VM is shown.
 
Oh, I overlooked in the first post that the value from the WebUI is given in GB, while the lvdisplay output is given in GiB, so if you convert the values, everything matches up, no issue there.

Please post the systemd journal of the host from around the time when the IO stalls in the VM appear, journalctl --since <DATETIME> --until <DATETIME> and your pveversion -v as well as the VM config qm config <VMID>. Is there a backup job running when the issue appears? Also, I would suggest to stick to virtio-scsi. Do you notice high IO delay on the host when the issue happens?

As to the size shown issue: Can we have this flagged as an inconsistency to be fixed in an upcoming version? Either the aim should be everything in GiB (prefered?) or else everything in GB.

As to the host logs: I'll have to wait for it to happen again and will post it then
 
Ok, the user has started his machine again at just after 15:00.

syslog has been attached.

Code:
# pveversion -v
proxmox-ve: 7.4-1 (running kernel: 5.15.108-1-pve)
pve-manager: 7.4-16 (running version: 7.4-16/0f39f621)
pve-kernel-5.15: 7.4-4
pve-kernel-5.13: 7.1-9
pve-kernel-5.3: 6.1-6
pve-kernel-5.15.108-1-pve: 5.15.108-2
pve-kernel-5.15.85-1-pve: 5.15.85-1
pve-kernel-5.15.83-1-pve: 5.15.83-1
pve-kernel-5.13.19-6-pve: 5.13.19-15
pve-kernel-5.4.162-1-pve: 5.4.162-2
pve-kernel-5.3.18-3-pve: 5.3.18-3
pve-kernel-5.3.10-1-pve: 5.3.10-1
ceph: 17.2.6-pve1
ceph-fuse: 17.2.6-pve1
corosync: 3.1.7-pve1
criu: 3.15-1+pve-1
glusterfs-client: 9.2-1
ifupdown: residual config
ifupdown2: 3.1.0-1+pmx4
ksm-control-daemon: 1.4-1
libjs-extjs: 7.0.0-1
libknet1: 1.24-pve2
libproxmox-acme-perl: 1.4.4
libproxmox-backup-qemu0: 1.3.1-1
libproxmox-rs-perl: 0.2.1
libpve-access-control: 7.4.1
libpve-apiclient-perl: 3.2-1
libpve-common-perl: 7.4-2
libpve-guest-common-perl: 4.2-4
libpve-http-server-perl: 4.2-3
libpve-network-perl: 0.7.3
libpve-rs-perl: 0.7.7
libpve-storage-perl: 7.4-3
libqb0: 1.0.5-1
libspice-server1: 0.14.3-2.1
lvm2: 2.03.11-2.1
lxc-pve: 5.0.2-2
lxcfs: 5.0.3-pve1
novnc-pve: 1.4.0-1
proxmox-backup-client: 2.4.3-1
proxmox-backup-file-restore: 2.4.3-1
proxmox-kernel-helper: 7.4-1
proxmox-mail-forward: 0.1.1-1
proxmox-mini-journalreader: 1.3-1
proxmox-offline-mirror-helper: 0.5.2
proxmox-widget-toolkit: 3.7.3
pve-cluster: 7.3-3
pve-container: 4.4-6
pve-docs: 7.4-2
pve-edk2-firmware: 3.20230228-4~bpo11+1
pve-firewall: 4.3-5
pve-firmware: 3.6-5
pve-ha-manager: 3.6.1
pve-i18n: 2.12-1
pve-qemu-kvm: 7.2.0-8
pve-xtermjs: 4.16.0-2
qemu-server: 7.4-4
smartmontools: 7.2-pve3
spiceterm: 3.2-2
swtpm: 0.8.0~bpo11+3
vncterm: 1.7-1
zfsutils-linux: 2.1.11-pve1

Code:
# qm config 199
agent: 1
balloon: 4096
bios: ovmf
boot: order=sata0
cores: 9
cpu: qemu64
ide2: cephfs:iso/FreeBSD-12.4-RELEASE-amd64-disc1.iso,media=cdrom,size=982436K
memory: 24576
meta: creation-qemu=7.1.0,ctime=1691437349
name: VO-IRIS-Poller-2
net0: virtio=AA:21:C9:74:4D:AD,bridge=vmbr2,firewall=1
numa: 0
onboot: 1
ostype: other
sata0: speedy:vm-199-disk-0,discard=on,size=140G,ssd=1
scsihw: virtio-scsi-single
smbios1: uuid=f2484309-298e-4b0c-9b4d-6a25288051f7
sockets: 2
tags: freebsd
unused0: local-lvm:vm-199-disk-0
vmgenid: f179581c-bdb1-4bf8-9d14-ab22d395ffa6

We can change back to scsi now I suppose, just haven't done it yet.

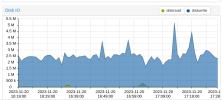
There is disk IO happening all the time of this machine. Here's the hourly maximum graph.

1700494194900.png

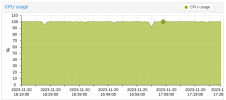
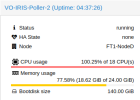
The CPU's are also being used all the time.

1700494281512.png


1700494359281.png
 

Attachments

  • syslog.txt
    6.3 KB · Views: 2
Last edited:
I changed the thread name to better describe the issue.
Is the storage called speedy related to the disk nvme1 of your host system? It seems that you might have issues with this device, from your journal we see:
Device: /dev/nvme1, Critical Warning (0x04): Reliability
 
Is the storage called speedy related to the disk nvme1 of your host system? It seems that you might have issues with this device, from your journal we see:
Device: /dev/nvme1, Critical Warning (0x04): Reliability
Reading the whole tread will be helpful. The nvme1 is part of a ceph pool, but the problem occurs regardless of which pool the VM uses, even if I move it to a local ext4 lvm-thin volume, the problem still occurs. Many other virtual machines are using that pool and they don't have any issues.
 
Reading the whole tread will be helpful
I am not sure what you are referring to, but nowhere in the thread was there the mention of which block device was related to which storage. That the issue seems to show up indepenent of the underlying storage seems clear.

Regarding the issue at hand:
  • Is this VM the same VM you already had trouble with in the past [0]?
  • How log does it take for the VM to run into the IO issues?
  • What process is using up all the CPU resources? Can you identify a process inside the VM which is causing the high cpu load, or is this the qemu process on the host itself?
  • There were issues related to KSM and memory ballooning in the past [1], probably not related but please try to see if disabling ballooning has any effect.
  • You can try to attach via strace to the qemu process and generate a backtrace using gdb as described in [2].

[0] https://forum.proxmox.com/threads/disk-errors-on-freebsd-12-2-guest.105753/
[1] https://forum.proxmox.com/threads/vms-freeze-with-100-cpu.127459/
[2] https://forum.proxmox.com/threads/vms-freeze-with-100-cpu.127459/post-561792
 
As to the size shown issue: Can we have this flagged as an inconsistency to be fixed in an upcoming version? Either the aim should be everything in GiB (prefered?) or else everything in GB.
For storage size information SI units (base 10) are used in Proxmox VE, as most of the storage providers give their sizes as such. I sent a patch to fix an inconsistent HD usage displayed in IEC units instead of SI units, https://lists.proxmox.com/pipermail/pve-devel/2023-November/060579.html
 
I am not sure what you are referring to, but nowhere in the thread was there the mention of which block device was related to which storage. That the issue seems to show up indepenent of the underlying storage seems clear.

Regarding the issue at hand:
  • Is this VM the same VM you already had trouble with in the past [0]?
Yes, this has been an ongoing problem. When we moved the storage to non-ceph lvm-thin storage, the problem seemed to go away. However, after a couple of weeks it started re-occuring exactly in the same way that it was on ceph rbd storage.

  • How log does it take for the VM to run into the IO issues?
There's no specific time. We have had a completed re-install in the past and it took only days to start happening again. When we moved off ceph rbd to lvm-thin, it took more than a month before it happened again.
  • What process is using up all the CPU resources? Can you identify a process inside the VM which is causing the high cpu load, or is this the qemu process on the host itself?
The system runs an IRIS poller which polls about 2000 devices all over the country on a regular interval. The CPU resources are in line with other pollers doing similar work

  • There were issues related to KSM and memory ballooning in the past [1], probably not related but please try to see if disabling ballooning has any effect.

We have tried that, but it makes no difference.

  • You can try to attach via strace to the qemu process and generate a backtrace using gdb as described in [2].

Will have to look into that and will report back. For now we have moved the storage to a different ceph rbd pool (containing spinners and ssd wal and rocksdb storage) and it seems to be running fine. I'm awaiting confirmation of this though.

 
Last edited:
We have done some more experiments with settings. If I increase the CPU's on this machine to 30, the problem of "D" state processes waiting for the disk practically goes away. However, while this may be a partial workaround, the problem is still that the CPU usage is way too high.

The process on FreeBSD essentially sends out an SNMP probe to a device, waits for a response, creates a .json file and writes it to disk. There are about 2000 devices that get polled like that every 5 minutes. The json files are small.

See the disk (Intel SSD) has a block size of 4096 and a logical sector size of 512. The volume pve-vm-199-disk-0 has the following:
MIN-IO OPT-IO PHY-SEC LOG-SEC 65536 65536 4096 512
Does that mean that if I change the volume to have a MIN-IO of 4096, the writes will be 16x optimal? Is so, how can I change that?

More than that, can I create a ceph rbd pool that has a 4096 block size as well, for this type of virtual machine? I don't see any parameter in the pool creation process that would allow me to set that.
I do have this is my ceph.conf
[osd] bluestore_min_alloc_size = 4096 bluestore_min_alloc_size_hdd = 4096 bluestore_min_alloc_size_ssd = 4096

However:
# rbd info --pool standard vm-199-disk-0 rbd image 'vm-199-disk-0': size 140 GiB in 35840 objects order 22 (4 MiB objects)

which indicates that I'm writing 4MiB chucks at a time. Can I change that for that volume to only write 4096 Bytes at a time?
 
Can I change that for that volume to only write 4096 Bytes at a time?
I found rbd migration prepare. However

# rbd migration prepare --object-size 4K --stripe-unit 64K --stripe-count 2 standard/vm-199-disk-0 standard/vm-199-disk-1
give me an error:
Code:
2023-11-22T13:04:18.177+0200 7fd9fe1244c0 -1 librbd::image::CreateRequest: validate_striping: stripe unit is not a factor of the object size
2023-11-22T13:04:18.177+0200 7fd9fe1244c0 -1 librbd::Migration: create_dst_image: header creation failed: (22) Invalid argument
rbd: preparing migration failed: (22) Invalid argument

I've even looked at the sourcecode to try to see what this means, since 64K is 16 x 4K... Can someone shed some light on this please?

Here's the source code that does the validation:
Code:
int validate_striping(CephContext *cct, uint8_t order, uint64_t stripe_unit,
                      uint64_t stripe_count) {
  if ((stripe_unit && !stripe_count) ||
      (!stripe_unit && stripe_count)) {
    lderr(cct) << "must specify both (or neither) of stripe-unit and "
               << "stripe-count" << dendl;
    return -EINVAL;
  } else if (stripe_unit && ((1ull << order) % stripe_unit || stripe_unit > (1ull << order))) {
    lderr(cct) << "stripe unit is not a factor of the object size" << dendl;
    return -EINVAL;
  } else if (stripe_unit != 0 && stripe_unit < 512) {
    lderr(cct) << "stripe unit must be at least 512 bytes" << dendl;
    return -EINVAL;
  }
  return 0;
}
 
Last edited:
See the disk (Intel SSD) has a block size of 4096 and a logical sector size of 512.
Not that most SSDs do not report their actual page size, these values have therefore not the meaning you might expect, see https://wiki.archlinux.org/title/Advanced_Format#NVMe_solid_state_drives

writing 4MiB chucks at a time
The 4M is the default object size used by RBD, I would not recommend to change this, see https://docs.ceph.com/en/quincy/man/8/rbd/#cmdoption-rbd-object-size

validate_striping: stripe unit is not a factor of the object size
As the error states, the stripe unit must be a factor of the object size, but you set 64K as stripe unit.

Are you sure your Ceph storage is performant enough to handle your workload? Does this VM perform a lot of sync writes?

Maybe you should check your baseline Ceph performance to see which configuration changes actually give a performance improvement. You can find example performance tests for Ceph in this document https://www.proxmox.com/images/download/pve/docs/Proxmox-VE_Ceph-Benchmark-202009-rev2.pdf.

As Jakob Bohm stated on the qemu discussion list, this is not such a simple issue, so you will have to have at least some baseline performance metrics to investigate further https://lists.nongnu.org/archive/html/qemu-discuss/2023-09/msg00031.html

Edit: Please also specify which SSD models you are using as OSDs in your Ceph cluster.
 
Last edited:
Are you sure your Ceph storage is performant enough to handle your workload? Does this VM perform a lot of sync writes?

If the problem only occures with ceph storage, then I would suspect that my ceph may not be able to handle it. But the intel-ssd is not a ceph volume and it happens there as much as it does on ceph storage.

The poller writes many small files quite often. I'll forward some sample and a directory listing as soon as I receive them


Edit: Please also specify which SSD models you are using as OSDs in your Ceph cluster.

I have one pool (speedy) with Intel 1TB NVMe drives (SSDPEKKA010T8). They are split into 3 LVs each and a 2 more LV for spinners' WAL and RocksDB.
The spinners are in a separate pool.
Code:
nvme0n1                                                                                               259:0    0 953.9G  0 disk
├─NodeD--nvme1-NodeD--nvme--LV--data1                                                                 253:0    0   290G  0 lvm 
├─NodeD--nvme1-NodeD--nvme--LV--data2                                                                 253:1    0   290G  0 lvm 
├─NodeD--nvme1-NodeD--nvme--LV--data3                                                                 253:2    0   290G  0 lvm 
├─NodeD--nvme1-NodeD--nvme--LV--RocksDB1                                                              253:4    0  41.9G  0 lvm 
└─NodeD--nvme1-NodeD--nvme--LV--RocksDB2                                                              253:6    0  41.9G  0 lvm 
nvme1n1                                                                                               259:1    0 953.9G  0 disk
├─NodeD--nvme2-NodeD--nvme--LV--data1                                                                 253:3    0   290G  0 lvm 
├─NodeD--nvme2-NodeD--nvme--LV--data2                                                                 253:5    0   290G  0 lvm 
├─NodeD--nvme2-NodeD--nvme--LV--data3                                                                 253:7    0   290G  0 lvm 
├─NodeD--nvme2-NodeD--nvme--LV--RocksDB1                                                              253:8    0  41.9G  0 lvm 
└─NodeD--nvme2-NodeD--nvme--LV--RocksDB2                                                              253:9    0  41.9G  0 lvm

The SSD that I have test with is a SSDSC2KB240G8 drive.

Currently the machine boots from a volume on the single non-ceph ssd drive and the json files are logged to a ceph volume I created for this purpose.

Code:
# rbd info -p speedy vm-199-disk-2
rbd image 'vm-199-disk-2':
    size 20 GiB in 5242880 objects
    order 12 (4 KiB objects)
    snapshot_count: 0
    id: e97509b78c6a0d
    block_name_prefix: rbd_data.e97509b78c6a0d
    format: 2
    features: layering, exclusive-lock, object-map, fast-diff, deep-flatten
    op_features:
    flags:
    create_timestamp: Wed Nov 22 13:18:30 2023
    access_timestamp: Wed Nov 22 13:18:30 2023
    modify_timestamp: Wed Nov 22 13:18:30 2023
root@FT1-NodeD:~# rbd du -p speedy vm-199-disk-2
NAME           PROVISIONED  USED   
vm-199-disk-2       20 GiB  4.1 GiB
 
Not that most SSDs do not report their actual page size, these values have therefore not the meaning you might expect, see https://wiki.archlinux.org/title/Advanced_Format#NVMe_solid_state_drives
Here's what my drives report:

Code:
# nvme id-ns -H /dev/nvme0n1 | grep "Relative Performance"
LBA Format  0 : Metadata Size: 0   bytes - Data Size: 512 bytes - Relative Performance: 0 Best (in use)

https://wiki.archlinux.org/title/Advanced_Format#NVMe_solid_state_drives
The 4M is the default object size used by RBD, I would not recommend to change this, see https://docs.ceph.com/en/quincy/man/8/rbd/#cmdoption-rbd-object-size

I used that man page to create a special rbd volume for small writes to see if it improves the situation...

As the error states, the stripe unit must be a factor of the object size, but you set 64K as stripe unit.

Yes, I see now, the stripe unit should be less and a factor of the object size. So if my object size is 4K I could as most have a 4K stripe unit, but it would make more sense to have a 16K object size and a stripe unit of 4K then, correct?

Are you sure your Ceph storage is performant enough to handle your workload? Does this VM perform a lot of sync writes?

I'll do some benchmarks using 4K writes on both the 4M volumes and the 4K volumes and see what I get.

Maybe you should check your baseline Ceph performance to see which configuration changes actually give a performance improvement. You can find example performance tests for Ceph in this document https://www.proxmox.com/images/download/pve/docs/Proxmox-VE_Ceph-Benchmark-202009-rev2.pdf.

As Jakob Bohm stated on the qemu discussion list, this is not such a simple issue, so you will have to have at least some baseline performance metrics to investigate further https://lists.nongnu.org/archive/html/qemu-discuss/2023-09/msg00031.html

Edit: Please also specify which SSD models you are using as OSDs in your Ceph cluster.
 

About

The Proxmox community has been around for many years and offers help and support for Proxmox VE, Proxmox Backup Server, and Proxmox Mail Gateway.
We think our community is one of the best thanks to people like you!

Get your subscription!

The Proxmox team works very hard to make sure you are running the best software and getting stable updates and security enhancements, as well as quick enterprise support. Tens of thousands of happy customers have a Proxmox subscription. Get yours easily in our online shop.

Buy now!