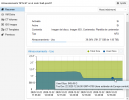
This I have observed for several versions ago, The storage graph and its data is not correct:
Here, the NFScb1 storage has 792G used:
But in the Storage summary section the graph is not correct, the graph data said 849,49G used and 2,15Tb of Total Size but the Total Size is 2Tb

I'm using pve manager 6.3.2
It would be great more info like "Free Size"
Here, the NFScb1 storage has 792G used:
Code:
root@dvall-prox05:~# df -h
Filesystem                 Size  Used Avail Use% Mounted on
udev                        20G     0   20G   0% /dev
tmpfs                      4.0G  170M  3.8G   5% /run
/dev/mapper/pve-root        17G  7.6G  8.2G  49% /
tmpfs                       20G   63M   20G   1% /dev/shm
tmpfs                      5.0M     0  5.0M   0% /run/lock
tmpfs                       20G     0   20G   0% /sys/fs/cgroup
/dev/mapper/pve-tmpBackup   32G   49M   30G   1% /mnt/tmpBackup
/dev/fuse                   30M   60K   30M   1% /etc/pve
192.168.254.30:/ProxmoxBK  2.0T  1.4T  570G  71% /mnt/pve/NFScb1BK
192.168.254.30:/Proxmox    2.0T  792G  1.2T  40% /mnt/pve/NFScb1
tmpfs                      4.0G     0  4.0G   0% /run/user/0
But in the Storage summary section the graph is not correct, the graph data said 849,49G used and 2,15Tb of Total Size but the Total Size is 2Tb

I'm using pve manager 6.3.2
It would be great more info like "Free Size"
Last edited:

