SSD Setup with huge write loads

cm350

Member
Jan 16, 2015
28
0
21
Hi all,

We deployed a Dell Poweredge T630 with a Perc H730 hardware controller and 6 Samsung 850 Pro SSD(s) in Raid6.

It has proxmox 3.4-15 on it with 1 pfsense firewall and 4 Server 2012R2's on it.

Its already running 1 year and a half without any problems and very fast. But the last months people are starting to complain everything is running a little bit slower.

I checked the proxmox interface, but could not see something wrong. Low cpu usage (40-60%), low memory usage (50%) and not very high disk loads.

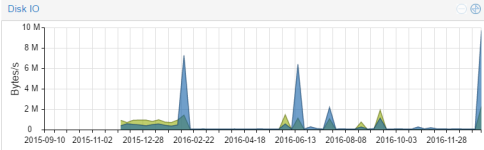
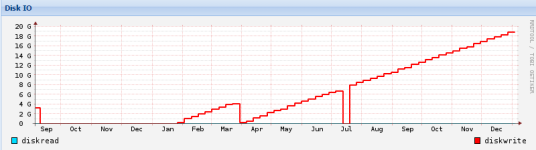
It starts to get freaky when I change the graphs in to Year (Max) and check the disk load.
If you check attached file you can see it really goes up. I am talking here about a firewall which really does not do a lot of disk writes/reads.
Every virtual machine has this problem.
My guess it has something to do with the notsoresponsive-ness the users are having.

I started to read a lot about trim, but with our hardware controller we cannot change the discard option or run fstrim.

Can anyone point us in to the right direction? :)
 

Attachments

  • Proxmox.PNG
    Proxmox.PNG
    14 KB · Views: 61
Have you checked all your SSD's / RAID / BBU Health.

I may be wrong but the graph just shows amount of read and write data overtime hence the slope which is fairly consistent.
 
If i must believe megaraidsas-status/iDraq everyting is allright. No smart status failed or degraded raid sets.

Attached I have a graph of the "same" server setup from another customer. It has only 2 windows servers and a lot less load if I must say. But you can see there is a big difference.
We see the same on our own server,which too has a ssd raid6 and a lot more load ;)
 

Attachments

  • Proxmox2.PNG
    Proxmox2.PNG
    20.1 KB · Views: 27
Last edited:
What does iotop show on your host, may need to run for a while and monitor to see if anything appears I/O wise that you don't expect.
 
If you see the increate in disk writes, it normally has nothing to do with your hardware raid controller, because it only "sees" the write from above the controller, so your disks are maybe fine. I'd recommend to run iotop as @Ashley suggested.
 
iotop has normal values (at least when I am looking at it).
Total DISK READ: 7.71 M/s | Total DISK WRITE: 7.68 M/s
TID PRIO USER DISK READ DISK WRITE SWAPIN IO> COMMAND
4733 be/4 root 7.53 M/s 7.47 M/s 0.00 % 6.62 % kvm -id 102 -chardev socket,id=qmp,path=/var/run/qemu-server/102.qmp,server,nowait -mon ~bootindex=300 -rtc driftfix=slew,base=localtime -global kvm-pit.lost_tick_policy=discard
6779 be/4 root 185.12 K/s 152.34 K/s 0.00 % 0.00 % kvm -id 104 -chardev socket,id=qmp,path=/var/run/qemu-server/104.qmp,server,nowait -mon ~bootindex=300 -rtc driftfix=slew,base=localtime -global kvm-pit.lost_tick_policy=discard
5854 be/4 root 0.00 B/s 1974.66 B/s 0.00 % 0.00 % kvm -id 103 -chardev socket,id=qmp,path=/var/run/qemu-server/103.qmp,server,nowait -mon ~bootindex=300 -rtc driftfix=slew,base=localtime -global kvm-pit.lost_tick_policy=discard
4420 be/4 root 0.00 B/s 61.71 K/s 0.00 % 0.00 % kvm -id 100 -chardev socket,id=qmp,path=/var/run/qemu-server/100.qmp,server,nowait -mon ~device e1000,mac=3A:25:C3:64:08:A1,netdev=net4,bus=pci.0,addr=0x16,id=net4,bootindex=304
1 be/4 root 0.00 B/s 0.00 B/s 0.00 % 0.00 % init [2]
2 be/4 root 0.00 B/s 0.00 B/s 0.00 % 0.00 % [kthreadd]

pveperf says this:
CPU BOGOMIPS: 76715.04
REGEX/SECOND: 1497440
HD SIZE: 3.81 GB (/dev/mapper/pve-root)
BUFFERED READS: 1365.33 MB/sec
AVERAGE SEEK TIME: 0.12 ms
FSYNCS/SECOND: 7593.29
DNS EXT: 38.62 ms
DNS INT: 40.01 ms
 
You said you run 6x Samsung 850 Pro in Raid 6 since about 18 month ?

We had a Cluster Server at work that was exclusively running Samsung 850 Pro's for a ceph cluster (others were different brands), that showed the same problem, until we noticed that some of em had TBW values was beyond the guaranteed values of Samsungs specs

we are talking 150 TBW for 128/256 GB models and 300 TBW for 512 /1024 / 2048 GB models (see link above)
ONCE we migrated the offending SSD's to new ones of the same model, the problem disappeared.

Typically i'd expect this to be accompanied by high iowait;
We are running about 200 servers with all types of SSD manufacturers and proxmox/ceph and this was the first and only incident like this.
Maybe you got "lucky" and this is the cause of your issue aswell.

Smart values for the drives should tell you quickly.
 
I had 5 minutes of time and checked the smart values of a ssd (i don't know which one :) )

241 Total_LBAs_Written 0x0032 099 099 000 Old_age Always - 175160135670

Which is a wooping 89 TB.

Which is a lot! So it really is suffering of high values of writes which I see in the proxmox graphs. What could this be? I mean if I check the graph of our firewall which has a 10GB virtual disk, it writes 20GB... (see attachment).

In the same attachment you can see it is normal since week 1 of this year (where I rebooted proxmox).

Our guess is that there is something wrong with the virtualization layer of proxmox?

@Q-wulf: io-delay does not get high: 0,10% was the highest for an hour
 

Attachments

  • Proxmox3.PNG
    Proxmox3.PNG
    63.7 KB · Views: 21
241 Total_LBAs_Written 0x0032 099 099 000 Old_age Always - 175160135670

Which is a wooping 89 TB.

That is 160 GB/day (18 month). Assuming you have 128/256GB SSD's you are only half way on the TBW these are rated for (if they are bigger models you are only looking at 1/4th the rated TBW)
to be clear. This does not sound like the problem i described above. As in that case the SSDs were past the rated TBW specs. You are not (yet).


Which is a lot! So it really is suffering of high values of writes which I see in the proxmox graphs. What could this be?

Our guess is that there is something wrong with the virtualization layer of proxmox?

@Q-wulf: io-delay does not get high: 0,10% was the highest for an hour

What services are hosted on these machines ? Any thing that is supposed to do a lot of writes ? Anything that does a lot of logging (small files; read: look up SSD write amplification on google)? Or anything that does a lot of Caching on the SSDs ?


you also could look up this threads were people report high SSD writes / wear-out.:
https://forum.proxmox.com/threads/high-ssd-wear-after-a-few-days.24840/page-2
https://forum.proxmox.com/threads/proxmox-4-x-is-killing-my-ssds.29732/page-2


Just incase you determine it is working as intended, have a look at this post:
https://forum.proxmox.com/threads/ssd-and-layout-recommendation.30972/#post-154834
The Guy figured out the price per TBW for certain models (including the larger Samsung Pro's), IMHO the rest of the thread is not worth reading, as the username is spot on :p

Which is a lot! So it really is suffering of high values of writes which I see in the proxmox graphs. What could this be? I mean if I check the graph of our firewall which has a 10GB virtual disk, it writes 20GB... (see attachment).

Is this a graph (week avarage) or week (max) ?
 
160GB/day does sound a lot for this setup. On the other hand, 100GB is nothing! I will check the TBW of other customers.
I did some fast calculation: 160GB/day = 6,67GB/hour = 113MB/minute = 1.89MB/sec which is not very mucht at all :)

1 pfsense firewall which really doesn't do anything on the disks. Or not a lot in fact!
1 DC server / file server (Windows 2012 R2)
2 Virtual Application Server (2x Windows 2012 R2) with each a SQL server (one express and one full blown) and indeed my guess is that one of them does backup its own db to its own disk (SSD storage)
1 RDS server which does not do a lot of disk usage because they need to work on the file shares :).

I will check that SQL!
The SQL db indeed backups to the ssd storage. The DB is around 12GB. So it should not be a very big problem.

The graph is Month (Max).
If you wanna see another one, I can give you other ones :)
But you can see the performance gain in week 1, why is that? Does proxmox cache things?
Has it anything to do with the fact is still is proxmox 3.4?
What is the upgrade path to v4 (without reinstalling the entire thing)?
 
Last edited:
160GB/day does sound a lot for this setup. On the other hand, 100GB is nothing! I will check the TBW of other customers.
I did some fast calculation: 160GB/day = 6,67GB/hour = 113MB/minute = 1.89MB/sec which is not very much at all :)
my point, Samsung Pro 256Gb models will only last you 32 month :p (150TBW rating)

  • 1 pfsense firewall which really doesn't do anything on the disks. Or not a lot in fact!
  • 1 DC server / file server (Windows 2012 R2)
  • 2 Virtual Application Server (2x Windows 2012 R2) with each a SQL server (one express and one full blown) and indeed my guess is that one of them does backup its own db to its own disk (SSD storage)
  • 1 RDS server which does not do a lot of disk usage because they need to work on the file shares :).

I will check that SQL!
The SQL db indeed backups to the ssd storage. The DB is around 12GB. So it should not be a very big problem.
The obvious choices here would be the file-server, logging on pfsense (lots of small io - check "write amplification SSD" on google) or swap usage on the windows machines.

The graph is Month (Max).
check for Month (average), see if it has any specific and obvious spikes or if it is rather uniformly growing. (the Max graph shows you the maximum data written during a timeframe e.g. 20GB over 60 Minutes, were as avarage shows you the average data writes, e.g. 10GB for 2 Minutes, and 0.17 GB for 58 Minutes - at least that is how interpret it :p)

But you can see the performance gain in week 1, why is that? Does proxmox cache things?
to me it suggests that the issue is actually connected to one or more VM's. The fact that you restarted the node, also means that you restarted the VMs. If there is a process hanging (and constantly writing), or you are out of ram and keep swapping until your drive breaks, or some such that gets resolved by a restart.


What is the upgrade path to v4 (without reinstalling the entire thing)?
paging @tom @dietmar @fabian or any other proxmox staff :p
 

About

The Proxmox community has been around for many years and offers help and support for Proxmox VE, Proxmox Backup Server, and Proxmox Mail Gateway.
We think our community is one of the best thanks to people like you!

Get your subscription!

The Proxmox team works very hard to make sure you are running the best software and getting stable updates and security enhancements, as well as quick enterprise support. Tens of thousands of happy customers have a Proxmox subscription. Get yours easily in our online shop.

Buy now!