Slow performance during backup

MisterDeeds

Active Member
Nov 11, 2021
143
34
33
35
Dear all

I have the following setup:
performance-min.png
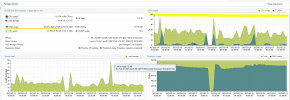
Using iperf I achieve the 10Gbits data transfer. However, if a backup is sterted, it is much slower:

Backup-Performance.PNG

Of all NICs the MTU is at 9000. Likewise, the storage is one SAS and one SATA SSD - which should also not bring any losses.

Does anyone have any ideas?

Thank you and best regards
 
You have multiple possibility root issues.
1. Source Storage
2. CPU on the Host
3. Destination Storage

Iperf check only the Network, can you start a read Benchmark on source and write Benchmark on destination site?
 
Hello and thanks for the answers.

Should the CPU be the bottleneck, this should be apparent in the dashboard, right?
1677140770407.png

Also the speed on the backup server look good:

Code:
root@PBS001:~# dd if=/dev/zero of=/mnt/datastore/pool0/test.file bs=1M count=20000
20000+0 records in
20000+0 records out
20971520000 bytes (21 GB, 20 GiB) copied, 7.09305 s, 3.0 GB/s

root@PBS001:~# dd if=/dev/zero of=/mnt/datastore/pool0/test.file bs=100M count=200
200+0 records in
200+0 records out
20971520000 bytes (21 GB, 20 GiB) copied, 10.1998 s, 2.1 GB/s

And the NAS:
Code:
ash-4.4# dd if=/dev/zero of=/volume1/test.file bs=1M count=20000
20000+0 records in
20000+0 records out
20971520000 bytes (21 GB, 20 GiB) copied, 13.9897 s, 1.5 GB/s
ash-4.4#

ash-4.4# dd if=/dev/zero of=/volume1/test.file bs=100M count=200
200+0 records in
200+0 records out
20971520000 bytes (21 GB, 20 GiB) copied, 13.1836 s, 1.6 GB/s

Or are there better or more meaningful tests for this?
 
can you run proxmox-backup-client benchmark --repository XXX on the PVE side (with XXX referring to your PBS) and proxmox-backup-client benchmark on the PBS side? the former tests PVE CPU performance and the network performance between PVE and PBS, the latter tests PBS CPU performance.
 
  • Like
Reactions: i_am_jam and vraa
Dear Fabian

Thank you for the commands, I did not know these. Here the results:

Code:
root@PBS001:~# proxmox-backup-client benchmark
SHA256 speed: 445.92 MB/s
Compression speed: 448.24 MB/s
Decompress speed: 637.78 MB/s
AES256/GCM speed: 1416.54 MB/s
Verify speed: 262.84 MB/s

┌───────────────────────────────────┬────────────────────┐
│ Name                              │ Value              │
╞═══════════════════════════════════╪════════════════════╡
│ TLS (maximal backup upload speed) │ not tested         │
├───────────────────────────────────┼────────────────────┤
│ SHA256 checksum computation speed │ 445.92 MB/s (22%)  │
├───────────────────────────────────┼────────────────────┤
│ ZStd level 1 compression speed    │ 448.24 MB/s (60%)  │
├───────────────────────────────────┼────────────────────┤
│ ZStd level 1 decompression speed  │ 637.78 MB/s (53%)  │
├───────────────────────────────────┼────────────────────┤
│ Chunk verification speed          │ 262.84 MB/s (35%)  │
├───────────────────────────────────┼────────────────────┤
│ AES256 GCM encryption speed       │ 1416.54 MB/s (39%) │
└───────────────────────────────────┴────────────────────┘

root@PBS001:~#

Code:
root@PVE001:~# proxmox-backup-client benchmark --repository pbs_client@pbs@192.168.14.155:pool0
Uploaded 912 chunks in 5 seconds.
Time per request: 5493 microseconds.
TLS speed: 763.56 MB/s
SHA256 speed: 478.37 MB/s
Compression speed: 559.28 MB/s
Decompress speed: 804.53 MB/s
AES256/GCM speed: 1789.86 MB/s
Verify speed: 306.48 MB/s

┌───────────────────────────────────┬────────────────────┐
│ Name                              │ Value              │
╞═══════════════════════════════════╪════════════════════╡
│ TLS (maximal backup upload speed) │ 763.56 MB/s (62%)  │
├───────────────────────────────────┼────────────────────┤
│ SHA256 checksum computation speed │ 478.37 MB/s (24%)  │
├───────────────────────────────────┼────────────────────┤
│ ZStd level 1 compression speed    │ 559.28 MB/s (74%)  │
├───────────────────────────────────┼────────────────────┤
│ ZStd level 1 decompression speed  │ 804.53 MB/s (67%)  │
├───────────────────────────────────┼────────────────────┤
│ Chunk verification speed          │ 306.48 MB/s (40%)  │
├───────────────────────────────────┼────────────────────┤
│ AES256 GCM encryption speed       │ 1789.86 MB/s (49%) │
└───────────────────────────────────┴────────────────────┘
root@PVE001:~#

What do you think about it?
 
that looks okay (still far from saturating a 10Gbit line though ;)). how is your VM storage configured? you could do benchmarks both on the PVE host and inside a VM (using fio, dd'ing zeroes is not a valid storage benchmark!).
 
  • Like
Reactions: vraa
Dear Fabian

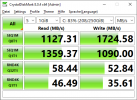
Thank you for the answer. I have now run a test inside a VM:

1677162718871.png

As well as on the proxmox itself with fio:
However, I am not sure if the parameters of fio are correct.
(The datastore is connected by NFS (4.1) )

Code:
root@PVE001:/mnt/pve/PVNAS1-Vm# fio --filename=test --sync=1 --rw=write --bs=4k --numjobs=1 --iodepth=4 --group_reporting --name=test --filesize=10G --runtime=300 && rm test

test: (g=0): rw=write, bs=(R) 4096B-4096B, (W) 4096B-4096B, (T) 4096B-4096B, ioengine=psync, iodepth=4

fio-3.25

Starting 1 process

test: Laying out IO file (1 file / 10240MiB)

Jobs: 1 (f=1): [W(1)][100.0%][w=35.3MiB/s][w=9025 IOPS][eta 00m:00s]

test: (groupid=0, jobs=1): err= 0: pid=3462189: Thu Feb 23 15:14:45 2023

write: IOPS=9035, BW=35.3MiB/s (37.0MB/s)(10.0GiB/290116msec); 0 zone resets

clat (usec): min=57, max=11788, avg=109.32, stdev=30.03

lat (usec): min=57, max=11789, avg=109.53, stdev=30.07

clat percentiles (usec):

| 1.00th=[ 73], 5.00th=[ 80], 10.00th=[ 85], 20.00th=[ 90],

| 30.00th=[ 95], 40.00th=[ 99], 50.00th=[ 104], 60.00th=[ 112],

| 70.00th=[ 120], 80.00th=[ 128], 90.00th=[ 139], 95.00th=[ 149],

| 99.00th=[ 186], 99.50th=[ 210], 99.90th=[ 293], 99.95th=[ 351],

| 99.99th=[ 562]

bw ( KiB/s): min=32568, max=41640, per=100.00%, avg=36156.57, stdev=1619.07, samples=580

iops : min= 8142, max=10410, avg=9039.14, stdev=404.77, samples=580

lat (usec) : 100=42.57%, 250=57.22%, 500=0.19%, 750=0.01%, 1000=0.01%

lat (msec) : 2=0.01%, 4=0.01%, 10=0.01%, 20=0.01%

cpu : usr=2.20%, sys=12.82%, ctx=2622273, majf=0, minf=23

IO depths : 1=100.0%, 2=0.0%, 4=0.0%, 8=0.0%, 16=0.0%, 32=0.0%, >=64=0.0%

submit : 0=0.0%, 4=100.0%, 8=0.0%, 16=0.0%, 32=0.0%, 64=0.0%, >=64=0.0%

complete : 0=0.0%, 4=100.0%, 8=0.0%, 16=0.0%, 32=0.0%, 64=0.0%, >=64=0.0%

issued rwts: total=0,2621440,0,0 short=0,0,0,0 dropped=0,0,0,0

latency : target=0, window=0, percentile=100.00%, depth=4

Run status group 0 (all jobs):

WRITE: bw=35.3MiB/s (37.0MB/s), 35.3MiB/s-35.3MiB/s (37.0MB/s-37.0MB/s), io=10.0GiB (10.7GB), run=290116-290116msec

root@PVE001:/mnt/pve/PVNAS1-Vm#


However, to be honest, the values do not say that much for me...
 
yeah, so it might just be that your read speed is the bottle neck (when doing a backup, the reads are pretty much random, not sequential). fio has some more examples in /usr/share/doc/fio/examples if you want to do more in-depth testing that better matches the workload of a backup (which is definitely not sync 4k writes ;))
 
Hi Fabian

Thanks for the feedback. I have now done a rand-read test with the following result.

Code:
root@PVE001:/mnt/pve/PVNAS1-Vm# fio /usr/share/doc/fio/examples/fio-rand-read.fio
file1: (g=0): rw=randread, bs=(R) 4096B-4096B, (W) 4096B-4096B, (T) 4096B-4096B, ioengine=libaio, iodepth=16
fio-3.25
Starting 1 process
file1: Laying out IO file (1 file / 10240MiB)
Jobs: 1 (f=1): [r(1)][100.0%][r=39.6MiB/s][r=10.1k IOPS][eta 00m:00s]
file1: (groupid=0, jobs=1): err= 0: pid=3717334: Thu Feb 23 16:47:32 2023
  read: IOPS=9766, BW=38.1MiB/s (40.0MB/s)(33.5GiB/900001msec)
    slat (usec): min=56, max=12270, avg=99.35, stdev=24.99
    clat (usec): min=3, max=1516.1k, avg=1536.83, stdev=3384.26
     lat (usec): min=123, max=1516.2k, avg=1636.44, stdev=3384.95
    clat percentiles (usec):
     |  1.00th=[ 1123],  5.00th=[ 1221], 10.00th=[ 1303], 20.00th=[ 1385],
     | 30.00th=[ 1434], 40.00th=[ 1483], 50.00th=[ 1532], 60.00th=[ 1565],
     | 70.00th=[ 1614], 80.00th=[ 1663], 90.00th=[ 1745], 95.00th=[ 1811],
     | 99.00th=[ 1975], 99.50th=[ 2089], 99.90th=[ 2933], 99.95th=[ 3458],
     | 99.99th=[ 5407]
   bw (  KiB/s): min= 5360, max=47456, per=100.00%, avg=39208.13, stdev=2392.66, samples=1793
   iops        : min= 1340, max=11864, avg=9802.01, stdev=598.16, samples=1793
  lat (usec)   : 4=0.01%, 250=0.01%, 500=0.01%, 750=0.01%, 1000=0.02%
  lat (msec)   : 2=99.13%, 4=0.82%, 10=0.03%, 20=0.01%, 2000=0.01%
  cpu          : usr=2.92%, sys=13.69%, ctx=8791014, majf=0, minf=728
  IO depths    : 1=0.1%, 2=0.1%, 4=0.1%, 8=0.1%, 16=100.0%, 32=0.0%, >=64=0.0%
     submit    : 0=0.0%, 4=100.0%, 8=0.0%, 16=0.0%, 32=0.0%, 64=0.0%, >=64=0.0%
     complete  : 0=0.0%, 4=100.0%, 8=0.0%, 16=0.1%, 32=0.0%, 64=0.0%, >=64=0.0%
     issued rwts: total=8789856,0,0,0 short=0,0,0,0 dropped=0,0,0,0
     latency   : target=0, window=0, percentile=100.00%, depth=16
Run status group 0 (all jobs):
   READ: bw=38.1MiB/s (40.0MB/s), 38.1MiB/s-38.1MiB/s (40.0MB/s-40.0MB/s), io=33.5GiB (36.0GB), run=900001-900001msec
root@PVE001:/mnt/pve/PVNAS1-Vm#

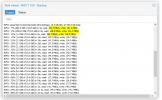
But do I see it right that the read transfer is only 38.0MB/s? Which would also be strange for me, since it is still 140MiB (146MB) for backup.
 
yes. but the backup will read in bigger blocks than 4k, and not completely random, so it sits somewhere between the two extremes. with network storage higher block size always means more throughput, since you are not affected (as much) by the added latency.
 
You are still doing 4K random reads while PBS is reading chunk files that are usually more like 2M.
 
  • Like
Reactions: vraa
Hello together

Thanks for the replies. I really do not know about it unfortunately.... so I'm asking a bit dumb.

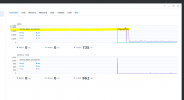
The IOPS increased during the test, but not to a level where the NAS should be busy.
1677169791751.png

What's weird for me is that the NAS is a Synology FS6400 with 48x Samsung PM1643 SAS SSDs in RAID F1.
1677169908350.png

Actually, this should "put" more. Can anyone explain this behavior?
 
Last edited:
Hi,

Can you re-draw your enviroment including your network swithes?

My best guess is that your backup is slow only you using PBB because of your switches topology.

All of your test was done for only one network side(nas only or nfs only). It will be more relevant to do your test at the same time(read from proxmox and write on PBS at the same time).

Regarding on your test, using a 1 G file size it has no relevance(caching, size of ram, and so on). A good test could be using alt least a file = 2x RAM size, and with uncomressed data.

It is not clear for me what kind of raid do you have use for Synology.

Good luck / Bafta!
 
  • Like
Reactions: MisterDeeds
Hi, thanks for the reply and inputs. I will have to look deeper into it again :) But if I know something new, I would post it here. Maybe it helps someone.

Have a nice weekend and best regards
 
Unfortunately not, in the meantime we have purchased a physical server, install Proxmox backup server baremetal and equipped it with 24 Samsung Enterprise SSDs. We then configured these to 6 VDEVS each as RAIDz1. Now the backup is fast.
 
  • Like
Reactions: UdoB

About

The Proxmox community has been around for many years and offers help and support for Proxmox VE, Proxmox Backup Server, and Proxmox Mail Gateway.
We think our community is one of the best thanks to people like you!

Get your subscription!

The Proxmox team works very hard to make sure you are running the best software and getting stable updates and security enhancements, as well as quick enterprise support. Tens of thousands of happy customers have a Proxmox subscription. Get yours easily in our online shop.

Buy now!