[SOLVED] Samsung 870 QVO 1TB Terrible Write Performance

fizzers123

New Member
Jan 7, 2021
5
2
3
26
Hi Everyone,

I got 2x Samsung 870 QVO 1TB. Iknow iknow, they are not the best and can be really slow and the lifespan isn't great.
My aim was to replace my current 8x 146 GB HDD setup, as I wanted to reduce power consumption.


I installed Proxmox on them with a ZFS mirror and the performance wasn't just bad. IT WAS TERRIBLE around 600 KiB/s Random Writes bad.
Naturally I started tinkering around with SLOG (using a Intel SSD), Phisical Drive Write Cache (PDWC, Dangerous), RAID controller etc...


1610036733625.png

Performance Test I used:
Random read
fio --filename=test --sync=1 --rw=randread --bs=4k --numjobs=1 --iodepth=4 --group_reporting --name=test --filesize=4G --runtime=300 && rm test

Random write
fio --filename=test --sync=1 --rw=randwrite --bs=4k --numjobs=1 --iodepth=4 --group_reporting --name=test --filesize=4G --runtime=300 && rm test

Sequential read
fio --filename=test --sync=1 --rw=read --bs=4k --numjobs=1 --iodepth=4 --group_reporting --name=test --filesize=4G --runtime=300 && rm test

Sequential write
fio --filename=test --sync=1 --rw=write --bs=4k --numjobs=1 --iodepth=4 --group_reporting --name=test --filesize=4G --runtime=300 && rm test


WHAT AM I DOING WRONG ?
Am I missing something here or are the SSD with Debian or EXT4 so bad ?
Any suggestions are welcome.

(I tested the SSD as well with Windows using Crystal Disk mark: RND4K Q32T1 was 287 MB/s Read and 270 MB/s Write, which is what I would expect).
 
  • Like
Reactions: meichthys
bs of 4k to low and forced sync.

Try the following:
fio --name=seqwrite --filename=fio_seqwrite.fio --refill_buffers --rw=write --direct=1 --loops=3 --ioengine=libaio --bs=1m --size=3G --runtime=60 --group_reporting && rm fio_seqwrite.fio
 
Hi Everyone,

I got 2x Samsung 870 QVO 1TB. Iknow iknow, they are not the best and can be really slow and the lifespan isn't great.

Yes, bad idea, they don't have power loss protection, so sync writes can't be considered done until really done, and that's slow.
I would buy Kingston DC500M (not 'R') 960GB for 200$ each (I know, your is $100, but trust me, it worths the price difference).
I.e. the first test on a DC500M where I've installed Proxmox and I have some VM running, ZFS single disk
Code:
root@proxmm01:~# fio --filename=test --sync=1 --rw=randread --bs=4k --numjobs=1 --iodepth=4 --group_reporting --name=test --filesize=4G --runtime=300 && rm test
test: (g=0): rw=randread, bs=(R) 4096B-4096B, (W) 4096B-4096B, (T) 4096B-4096B, ioengine=psync, iodepth=4
fio-3.12
Starting 1 process
test: Laying out IO file (1 file / 4096MiB)
Jobs: 1 (f=1): [r(1)][95.0%][r=232MiB/s][r=59.4k IOPS][eta 00m:01s]
test: (groupid=0, jobs=1): err= 0: pid=1528: Thu Jan  7 18:13:11 2021
  read: IOPS=55.7k, BW=217MiB/s (228MB/s)(4096MiB/18836msec)
    clat (nsec): min=1313, max=200315, avg=17574.24, stdev=7097.72
     lat (nsec): min=1343, max=200345, avg=17609.39, stdev=7098.48
    clat percentiles (nsec):
     |  1.00th=[  1768],  5.00th=[  2576], 10.00th=[  2800], 20.00th=[ 18304],
     | 30.00th=[ 18816], 40.00th=[ 19072], 50.00th=[ 19328], 60.00th=[ 19584],
     | 70.00th=[ 20096], 80.00th=[ 20864], 90.00th=[ 21888], 95.00th=[ 23936],
     | 99.00th=[ 31616], 99.50th=[ 35072], 99.90th=[ 42752], 99.95th=[ 47872],
     | 99.99th=[130560]
   bw (  KiB/s): min=177048, max=294688, per=97.81%, avg=217796.84, stdev=17577.59, samples=37
   iops        : min=44262, max=73672, avg=54449.19, stdev=4394.39, samples=37
  lat (usec)   : 2=1.66%, 4=13.74%, 10=0.21%, 20=54.19%, 50=30.16%
  lat (usec)   : 100=0.02%, 250=0.02%
  cpu          : usr=2.86%, sys=96.95%, ctx=5494, majf=8, minf=10
  IO depths    : 1=100.0%, 2=0.0%, 4=0.0%, 8=0.0%, 16=0.0%, 32=0.0%, >=64=0.0%
     submit    : 0=0.0%, 4=100.0%, 8=0.0%, 16=0.0%, 32=0.0%, 64=0.0%, >=64=0.0%
     complete  : 0=0.0%, 4=100.0%, 8=0.0%, 16=0.0%, 32=0.0%, 64=0.0%, >=64=0.0%
     issued rwts: total=1048576,0,0,0 short=0,0,0,0 dropped=0,0,0,0
     latency   : target=0, window=0, percentile=100.00%, depth=4

Run status group 0 (all jobs):
   READ: bw=217MiB/s (228MB/s), 217MiB/s-217MiB/s (228MB/s-228MB/s), io=4096MiB (4295MB), run=18836-18836msec

and

Code:
root@proxmm01:~# fio --filename=test --sync=1 --rw=write --bs=4k --numjobs=1 --iodepth=4 --group_reporting --name=test --filesize=4G --runtime=300 && rm test
test: (g=0): rw=write, bs=(R) 4096B-4096B, (W) 4096B-4096B, (T) 4096B-4096B, ioengine=psync, iodepth=4
fio-3.12
Starting 1 process
test: Laying out IO file (1 file / 4096MiB)
Jobs: 1 (f=1): [W(1)][100.0%][w=43.4MiB/s][w=11.1k IOPS][eta 00m:00s]
test: (groupid=0, jobs=1): err= 0: pid=6436: Thu Jan  7 18:34:02 2021
  write: IOPS=11.5k, BW=44.0MiB/s (47.2MB/s)(4096MiB/91023msec); 0 zone resets
    clat (usec): min=71, max=341536, avg=86.41, stdev=406.30
     lat (usec): min=71, max=341536, avg=86.47, stdev=406.30
    clat percentiles (usec):
     |  1.00th=[   74],  5.00th=[   76], 10.00th=[   77], 20.00th=[   79],
     | 30.00th=[   80], 40.00th=[   82], 50.00th=[   83], 60.00th=[   86],
     | 70.00th=[   89], 80.00th=[   92], 90.00th=[   94], 95.00th=[   98],
     | 99.00th=[  116], 99.50th=[  120], 99.90th=[  210], 99.95th=[  223],
     | 99.99th=[  586]
   bw (  KiB/s): min=14144, max=52598, per=100.00%, avg=46077.03, stdev=4334.62, samples=182
   iops        : min= 3536, max=13149, avg=11519.25, stdev=1083.65, samples=182
  lat (usec)   : 100=96.49%, 250=3.48%, 500=0.02%, 750=0.01%, 1000=0.01%
  lat (msec)   : 2=0.01%, 4=0.01%, 10=0.01%, 50=0.01%, 100=0.01%
  lat (msec)   : 500=0.01%
  cpu          : usr=0.89%, sys=13.99%, ctx=2098158, majf=0, minf=12
  IO depths    : 1=100.0%, 2=0.0%, 4=0.0%, 8=0.0%, 16=0.0%, 32=0.0%, >=64=0.0%
     submit    : 0=0.0%, 4=100.0%, 8=0.0%, 16=0.0%, 32=0.0%, 64=0.0%, >=64=0.0%
     complete  : 0=0.0%, 4=100.0%, 8=0.0%, 16=0.0%, 32=0.0%, 64=0.0%, >=64=0.0%
     issued rwts: total=0,1048576,0,0 short=0,0,0,0 dropped=0,0,0,0
     latency   : target=0, window=0, percentile=100.00%, depth=4

Run status group 0 (all jobs):
  WRITE: bw=44.0MiB/s (47.2MB/s), 44.0MiB/s-44.0MiB/s (47.2MB/s-47.2MB/s), io=4096MiB (4295MB), run=91023-91023msec
root@proxmm01:~#
 
  • Like
Reactions: fizzers123
bs of 4k to low and forced sync.

Try the following:
fio --name=seqwrite --filename=fio_seqwrite.fio --refill_buffers --rw=write --direct=1 --loops=3 --ioengine=libaio --bs=1m --size=3G --runtime=60 --group_reporting && rm fio_seqwrite.fio
Hi H4R0

Thanks for your quick reply.

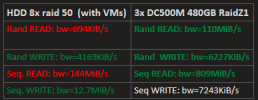
On my 8x HDD setup: Seq WRITE: bw=505MiB/s (Rand WRITE: bw=257MiB/s )
I set up the ZFS Proxmox fresh again with the 2x QVO in ZFS mirror and got: Seq. WRITE: bw=134MiB/s (Rand. WRITE: bw=124MiB/s)
Which is a lot more reasonable.
Last time I Migrated my VMs to the QVO Server IODelay started increase extremely. I will migrate some VMs Today to try to reproduce it.
1610041684881.png

@mmenaz I will definitely consider selling the QVO and getting the DC500M.

Code:
root@hst-proxmox-3:~# fio --name=seqwrite --filename=fio_seqwrite.fio --refill_buffers --rw=write --direct=1 --loops=3 --ioengine=libaio --bs=1m --size=3G --runtime=60 --group_reporting && rm fio_seqwrite.fio
seqwrite: (g=0): rw=write, bs=(R) 1024KiB-1024KiB, (W) 1024KiB-1024KiB, (T) 1024KiB-1024KiB, ioengine=libaio, iodepth=1
fio-3.12
Starting 1 process
seqwrite: Laying out IO file (1 file / 3072MiB)
Jobs: 1 (f=1): [W(1)][100.0%][w=42.0MiB/s][w=42 IOPS][eta 00m:00s]
seqwrite: (groupid=0, jobs=1): err= 0: pid=5937: Thu Jan  7 18:38:37 2021
  write: IOPS=134, BW=134MiB/s (141MB/s)(8062MiB/60015msec); 0 zone resets
    slat (usec): min=430, max=45283, avg=7195.85, stdev=8048.65
    clat (nsec): min=1442, max=81866, avg=2701.90, stdev=2020.75
     lat (usec): min=445, max=45289, avg=7199.43, stdev=8049.26
    clat percentiles (nsec):
     |  1.00th=[ 1512],  5.00th=[ 1576], 10.00th=[ 1608], 20.00th=[ 1656],
     | 30.00th=[ 1832], 40.00th=[ 2640], 50.00th=[ 2736], 60.00th=[ 2800],
     | 70.00th=[ 2928], 80.00th=[ 3088], 90.00th=[ 3408], 95.00th=[ 3824],
     | 99.00th=[ 6368], 99.50th=[11200], 99.90th=[21888], 99.95th=[34560],
     | 99.99th=[81408]
   bw (  KiB/s): min=28672, max=1265664, per=99.97%, avg=137517.83, stdev=215834.23, samples=120
   iops        : min=   28, max= 1236, avg=134.19, stdev=210.75, samples=120
  lat (usec)   : 2=33.79%, 4=62.04%, 10=3.62%, 20=0.37%, 50=0.12%
  lat (usec)   : 100=0.05%
  cpu          : usr=3.42%, sys=8.45%, ctx=49093, majf=7, minf=19
  IO depths    : 1=100.0%, 2=0.0%, 4=0.0%, 8=0.0%, 16=0.0%, 32=0.0%, >=64=0.0%
     submit    : 0=0.0%, 4=100.0%, 8=0.0%, 16=0.0%, 32=0.0%, 64=0.0%, >=64=0.0%
     complete  : 0=0.0%, 4=100.0%, 8=0.0%, 16=0.0%, 32=0.0%, 64=0.0%, >=64=0.0%
     issued rwts: total=0,8062,0,0 short=0,0,0,0 dropped=0,0,0,0
     latency   : target=0, window=0, percentile=100.00%, depth=1

Run status group 0 (all jobs):
  WRITE: bw=134MiB/s (141MB/s), 134MiB/s-134MiB/s (141MB/s-141MB/s), io=8062MiB (8454MB), run=60015-60015msec
root@hst-proxmox-3:~# fio --name=randwrite --filename=fio_seqwrite.fio --refill_buffers --rw=randwrite --direct=1 --loops=3 --ioengine=libaio --bs=1m --size=3G --runtime=60 --group_reporting && rm fio_seqwrite.fio
randwrite: (g=0): rw=randwrite, bs=(R) 1024KiB-1024KiB, (W) 1024KiB-1024KiB, (T) 1024KiB-1024KiB, ioengine=libaio, iodepth=1
fio-3.12
Starting 1 process
randwrite: Laying out IO file (1 file / 3072MiB)
Jobs: 1 (f=1): [w(1)][100.0%][w=42.0MiB/s][w=42 IOPS][eta 00m:00s]
randwrite: (groupid=0, jobs=1): err= 0: pid=9870: Thu Jan  7 18:39:44 2021
  write: IOPS=123, BW=124MiB/s (130MB/s)(7426MiB/60023msec); 0 zone resets
    slat (usec): min=345, max=42261, avg=7840.46, stdev=6607.34
    clat (nsec): min=1379, max=64999, avg=2780.03, stdev=1450.47
     lat (usec): min=347, max=42263, avg=7844.12, stdev=6607.47
    clat percentiles (nsec):
     |  1.00th=[ 1528],  5.00th=[ 1656], 10.00th=[ 1736], 20.00th=[ 1880],
     | 30.00th=[ 2384], 40.00th=[ 2800], 50.00th=[ 2896], 60.00th=[ 2960],
     | 70.00th=[ 3024], 80.00th=[ 3120], 90.00th=[ 3280], 95.00th=[ 3440],
     | 99.00th=[ 6112], 99.50th=[ 9408], 99.90th=[19840], 99.95th=[24960],
     | 99.99th=[64768]
   bw (  KiB/s): min=40960, max=1224704, per=100.00%, avg=126698.61, stdev=159942.53, samples=120
   iops        : min=   40, max= 1196, avg=123.64, stdev=156.21, samples=120
  lat (usec)   : 2=24.28%, 4=73.04%, 10=2.25%, 20=0.34%, 50=0.08%
  lat (usec)   : 100=0.01%
  cpu          : usr=3.31%, sys=7.82%, ctx=52079, majf=0, minf=555
  IO depths    : 1=100.0%, 2=0.0%, 4=0.0%, 8=0.0%, 16=0.0%, 32=0.0%, >=64=0.0%
     submit    : 0=0.0%, 4=100.0%, 8=0.0%, 16=0.0%, 32=0.0%, 64=0.0%, >=64=0.0%
     complete  : 0=0.0%, 4=100.0%, 8=0.0%, 16=0.0%, 32=0.0%, 64=0.0%, >=64=0.0%
     issued rwts: total=0,7426,0,0 short=0,0,0,0 dropped=0,0,0,0
     latency   : target=0, window=0, percentile=100.00%, depth=1

Run status group 0 (all jobs):
  WRITE: bw=124MiB/s (130MB/s), 124MiB/s-124MiB/s (130MB/s-130MB/s), io=7426MiB (7787MB), run=60023-60023msec
root@hst-proxmox-3:~#
 
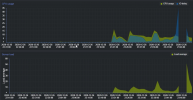
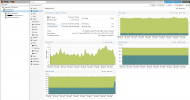
I now migrated my most demanding VM. I runs ElasticSearch and collects some logs, not a lot tho (about 2-3 GB a day).

During the Migration:
proxmox_performance_issue.png
After the Migration

proxmox_performance_issue_2.png

It seems like the ram is cashing a lot, as the VM only has 8 GB Ram :
Code:
root@hst-proxmox-3:~# arc_summary -g


    ARC: 40.7 GiB (86.2 %)  MFU: 1.1 GiB  MRU: 39.4 GiB  META: 294.0 MiB (35.4 GiB) DNODE 29.3 MiB (3.5 GiB)
    +----------------------------------------------------------+
    |FRRRRRRRRRRRRRRRRRRRRRRRRRRRRRRRRRRRRRRRRRRRRRRRRRR       |
    +----------------------------------------------------------+


root@hst-proxmox-3:~#

Is there anything I can do to my current 2x QVO setup to fix the ram Usage and the IO-Delays.
Or is the only way to get new SSDs ?

Regards
Fiz.
 
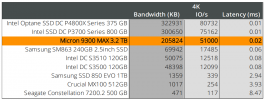
Using bs 4k and sync is not wrong per se. We actually use those settings for our benchmarks.

Our ZFS benchmark should be interesting for you:
zfs.png
The image shows what we got using
Code:
fio --ioengine=libaio --filename=/dev/sdx --direct=1 --sync=1 --rw=write --bs=4K --numjobs=1 --iodepth=1 --runtime=60 --time_based --name=fio
 
Using bs 4k and sync is not wrong per se. We actually use those settings for our benchmarks.

Our ZFS benchmark should be interesting for you:
View attachment 22627
The image shows what we got using
Code:
fio --ioengine=libaio --filename=/dev/sdx --direct=1 --sync=1 --rw=write --bs=4K --numjobs=1 --iodepth=1 --runtime=60 --time_based --name=fio
This benchmark DESTROYES /dev/sdX, better remind it :)
 
  • Like
Reactions: Dominic
Code:
oot@hst-proxmox-3:~# fio --ioengine=libaio --filename=test --direct=1 --sync=1 --rw=write --bs=4K --numjobs=1 --iodepth=1 --runtime=60 --time_based --name=fio --size=3G
fio: (g=0): rw=write, bs=(R) 4096B-4096B, (W) 4096B-4096B, (T) 4096B-4096B, ioengine=libaio, iodepth=1
fio-3.12
Starting 1 process
fio: Laying out IO file (1 file / 3072MiB)
Jobs: 1 (f=1): [W(1)][100.0%][w=744KiB/s][w=186 IOPS][eta 00m:00s]
fio: (groupid=0, jobs=1): err= 0: pid=18264: Sat Jan  9 00:40:10 2021
  write: IOPS=214, BW=859KiB/s (880kB/s)(50.4MiB/60002msec); 0 zone resets
    slat (msec): min=2, max=390, avg= 4.65, stdev= 6.52
    clat (nsec): min=1842, max=96710, avg=3284.62, stdev=1263.02
     lat (msec): min=2, max=390, avg= 4.65, stdev= 6.52
    clat percentiles (nsec):
     |  1.00th=[ 2128],  5.00th=[ 3152], 10.00th=[ 3184], 20.00th=[ 3184],
     | 30.00th=[ 3184], 40.00th=[ 3216], 50.00th=[ 3216], 60.00th=[ 3216],
     | 70.00th=[ 3248], 80.00th=[ 3248], 90.00th=[ 3280], 95.00th=[ 3504],
     | 99.00th=[ 4832], 99.50th=[ 5472], 99.90th=[ 6816], 99.95th=[15552],
     | 99.99th=[59648]
   bw (  KiB/s): min=  208, max= 1192, per=100.00%, avg=859.09, stdev=234.37, samples=120
   iops        : min=   52, max=  298, avg=214.72, stdev=58.60, samples=120
  lat (usec)   : 2=0.44%, 4=95.87%, 10=3.60%, 20=0.05%, 50=0.01%
  lat (usec)   : 100=0.03%
  cpu          : usr=0.34%, sys=2.41%, ctx=25802, majf=0, minf=23
  IO depths    : 1=100.0%, 2=0.0%, 4=0.0%, 8=0.0%, 16=0.0%, 32=0.0%, >=64=0.0%
     submit    : 0=0.0%, 4=100.0%, 8=0.0%, 16=0.0%, 32=0.0%, 64=0.0%, >=64=0.0%
     complete  : 0=0.0%, 4=100.0%, 8=0.0%, 16=0.0%, 32=0.0%, 64=0.0%, >=64=0.0%
     issued rwts: total=0,12892,0,0 short=0,0,0,0 dropped=0,0,0,0
     latency   : target=0, window=0, percentile=100.00%, depth=1


Run status group 0 (all jobs):
  WRITE: bw=859KiB/s (880kB/s), 859KiB/s-859KiB/s (880kB/s-880kB/s), io=50.4MiB (52.8MB), run=60002-60002msec
root@hst-proxmox-3:~#

The speed is terrible IOPS=214 . If no one has an idea how I could improve it i will get the Kingston DC500M (not 'R') 960GB for 200$.
Thanks all for your help.
 
Hello.
I faced the similar problem with 870 QVO 1Tb.
I tested on LVM thin, directory configs... Proxmox 6.4 latest.
Results:
Sequential, random reads - 520-550Mbps
Seuqential, random writes - 78-81Mbps.
And there is no matter that is sequential or random...

Tried this ssd on windows machine - seuqential r/w - 530Mb

Random r/w 128K blocks (as i setup in lvm) - 520Mb
Random 4k rw - 130Mb.

In fact in windows enviroment all is good (magnician not installed, only clear system) but in proxmox - i can't use it for 2 VMs...

On that host there is crucial mx500 and ryzen5 ssd installed - no problems.

P. S.
Firmware on ssd was updated to latest. Sata cable changed twice))
PSU 700w, bios updated (tuf b450m pro)
Also i noticed that first 20-30Gb writes at 500Mbps and then speed became slow
 
Last edited:
Did you test it with fio? If not comparing PVE and Win is a bit useless unless you use the same tool doing the same workload for both.
 
On windows tests was simple.
Copy/paste, move from other ssd, crystaldismmark with changed options like bs=4k (bs=128k), queues=1,3,8,filesize = 30Gb, 20k files (in folder) by 3-8k each.

On linux (tried on PVE, debian 10,ubuntu 18.04)
dd, fio (like upper in posts) - same results approx 2-5Mb difference

So, i'm wondered what is wrong in linux
 
You should run fio with the same arguments in windows too. Comparing results of different benchmark programs makes no sense. With fio you for example often do sync writes and with crystaldiskmark only uses async writes and so on.
Run fio in windows with 4k random sync writes and you will see something like 2MB/s performance there too.
 
Last edited:
QLC nand is too slow, there is a write cache but once it's consumed, write is slower than hdd even on Windows.
e.g. on Windows I disk-filltest a crucial p1 nvme 1TB, 1,7GB/s for the first 130GB written then slowdown to 50MB/s...

edit : You shoud set cache to writecache on vdisk of hardware of vm to compare to Windows
 
Last edited:
Thank for your reply.
I found similar answers about caching.
Yes, if i create VM on 870qvo and use it with write-back cache the performance is very high.
But if i migrate VM to this ssd the performance is very slow after 20-40Gb of transfer. But after about 20mins the performance of working VM returns to "normal", as i can understand ssd cache flushes...
I understand that 870qvo is very bad for PVE usage, but for now i have no ability to change it fast to crucial and seek for something like "enable async writes to ssd" on linux.
All linux systems as i can see use sync writes by default. (of course with usual use you'll not see any performance degrades because it happens after 40Gb of sequential write)
 
It depends on the software you run on Win or Linux how much writes are sync and how much async. Per default linux also uses the faster async for most of the writes.

And you don't want to only use async writes because they are not save and can corrupt your filesystems. So best is you allow both and let the software decide when to use the slow but secure sync writes or fast but unsecure async writes.
 
Last edited:

About

The Proxmox community has been around for many years and offers help and support for Proxmox VE, Proxmox Backup Server, and Proxmox Mail Gateway.
We think our community is one of the best thanks to people like you!

Get your subscription!

The Proxmox team works very hard to make sure you are running the best software and getting stable updates and security enhancements, as well as quick enterprise support. Tens of thousands of happy customers have a Proxmox subscription. Get yours easily in our online shop.

Buy now!