Random question marks instead of vm name

adim

New Member
Oct 19, 2022
4
0
1
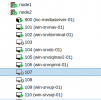
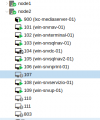
Hi guys, for a few days on a node of the cluster some question marks have been appearing and disappearing randomly instead of the name of the vm.
The pve version is pve-manager/7.3-6/723bb6ec (running kernel: 5.15.85-1-pve)
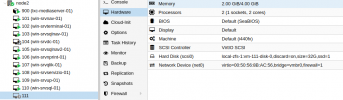
The configuration I made different from usual is to have enabled ZFS LOG and L2ARC Cache.
I attach the picture showing the problem.
Please help me fix this anomaly.
Thank you.
 

Attachments

  • Schermata a 2023-03-27 11-13-27.png
    Schermata a 2023-03-27 11-13-27.png
    18.1 KB · Views: 7
Hello,

Did you see anything interesting in the syslog/journalctl when the issue occurs?
Can you please tell us more about the VMs who have a question marks?
- Are the VMs the same OS installed?
- Are the VMs who got the question marks have the same configuration (specific on the same storage)?
- Does the VMs are still running and you can access them?
 
Hello,
Thanks and sorry for the delay in replying.

- The problem presents both on vm windows and linux.

- In the syslog I found this report for every vm that has the question mark
Code:
Mar 30 22:39:49 node2 pvedaemon[2508633]: VM 105 qmp command failed - VM 105 qmp command 'guest-ping' failed - got timeout

- There are two storages, both zfs this is the configuration but the problem occurs on vm that have storage both on rpool and on rpool1.
Code:
root@node2:~# zpool iostat -v
                                                 capacity     operations     bandwidth
pool                                           alloc   free   read  write   read  write
---------------------------------------------  -----  -----  -----  -----  -----  -----
rpool                                          1.84T   778G  1.25K    328  16.5M  16.7M
  mirror-0                                      643G   245G    403     88  5.65M  3.97M
    ata-VK000960GWSXH_195025735CF2-part3           -      -    201     44  2.82M  1.99M
    ata-VK000960GWSXH_200826A77475-part3           -      -    201     44  2.83M  1.99M
  mirror-1                                      623G   265G    411     93  5.46M  4.16M
    ata-VK000960GWSXH_19502573480E-part3           -      -    194     47  2.66M  2.08M
    ata-VK000960GWTHB_FN13N5335I0103L25-part3      -      -    216     46  2.80M  2.08M
  mirror-2                                      620G   268G    460     89  5.43M  4.06M
    ata-VK000960GWSRT_S4NBNA0R400161-part3         -      -    264     44  2.89M  2.03M
    ata-VK000960GWTHB_FN13N5335I0103L2B-part3      -      -    196     45  2.54M  2.03M
logs                                               -      -      -      -      -      -
  mirror-3                                     16.0M  93.5G      0     64      0  5.20M
    sdk1                                           -      -      0     32      0  2.60M
    sdl1                                           -      -      0     32      0  2.60M
cache                                              -      -      -      -      -      -
  sdk2                                          261G  17.4G    204     23  1.64M  2.45M
  sdl2                                          261G  17.5G    204     23  1.64M  2.45M
---------------------------------------------  -----  -----  -----  -----  -----  -----
rpool1                                          103G  1.52T      3     17   170K   219K
  raidz1-0                                      103G  1.52T      3     17   170K   219K
    scsi-3500003986813ee69                         -      -      1      5  56.8K  72.9K
    scsi-350000398680b49d1                         -      -      1      5  56.7K  72.9K
    scsi-350000398680b4939                         -      -      1      5  56.8K  72.9K
---------------------------------------------  -----  -----  -----  -----  -----  -----

- The vm works regularly, moreover it is only a visual matter, in fact I select the vm from the GUI I can work on it regularly as you can see from the following screenshot.
 

Attachments

  • Schermata a 2023-03-30 22-34-29.png
    Schermata a 2023-03-30 22-34-29.png
    19.3 KB · Views: 1
  • Schermata a 2023-03-30 22-49-25.png
    Schermata a 2023-03-30 22-49-25.png
    65.5 KB · Views: 1
I found these in syslog
Code:
Mar 30 23:02:56 node2 pvestatd[2380]: node status update error: metrics send error 'local-influxdb': failed to send metrics: Connection refused
Mar 30 23:02:56 node2 pvestatd[2380]: qemu status update error: metrics send error 'local-influxdb': failed to send metrics: Connection refused

so i removed the wrong metric server configuration and for now the problem seems to be gone.
I will monitor the node and see if it comes back.
 
Yes I had that problem with enabled metrics server and the server didnt respond/Take in the metics. Then the gui was acting up. Try to remove the metrics server configuration and you should be fine.
 
I found these in syslog
Code:
Mar 30 23:02:56 node2 pvestatd[2380]: node status update error: metrics send error 'local-influxdb': failed to send metrics: Connection refused
Mar 30 23:02:56 node2 pvestatd[2380]: qemu status update error: metrics send error 'local-influxdb': failed to send metrics: Connection refused

so i removed the wrong metric server configuration and for now the problem seems to be gone.
I will monitor the node and see if it comes back.

For reference:
https://bugzilla.proxmox.com/show_bug.cgi?id=4130
 

About

The Proxmox community has been around for many years and offers help and support for Proxmox VE, Proxmox Backup Server, and Proxmox Mail Gateway.
We think our community is one of the best thanks to people like you!

Get your subscription!

The Proxmox team works very hard to make sure you are running the best software and getting stable updates and security enhancements, as well as quick enterprise support. Tens of thousands of happy customers have a Proxmox subscription. Get yours easily in our online shop.

Buy now!