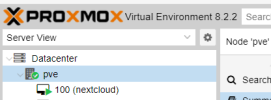
[SOLVED] pve node summary never loads / forever spinner
- Thread starter FuriousRage
- Start date
You are using an out of date browser. It may not display this or other websites correctly.
You should upgrade or use an alternative browser.
You should upgrade or use an alternative browser.
Tried a different browser / incognito window to see if it's just a caching thing?
And on the left (just outside of your screenshot), is the node itself with a green check or a grey question-mark?
And on the left (just outside of your screenshot), is the node itself with a green check or a grey question-mark?
I just tried firefox, that never have visited the pve page, still spins there.Tried a different browser / incognito window to see if it's just a caching thing?
And on the left (just outside of your screenshot), is the node itself with a green check or a grey question-mark?
currently using Vivaldi, and the spinner-thing worked earlier yesterday.
icon:

As far as I know, the summary-page is created by the pvestatd service, could you check if it has any errors/warnings in the logs and/or in
systemctl status pvestatd, or if restarting that service with systemctl restart pvestatd helps?As far as I know, the summary-page is created by the pvestatd service, could you check if it has any errors/warnings in the logs and/or insystemctl status pvestatd, or if restarting that service withsystemctl restart pvestatdhelps?
still spinns:
root@pve:~# systemctl status pvestatd● pvestatd.service - PVE Status Daemon Loaded: loaded (/lib/systemd/system/pvestatd.service; enabled; preset: enabled) Active: active (running) since Sat 2024-07-20 23:39:49 CEST; 12h ago Process: 1981 ExecStart=/usr/bin/pvestatd start (code=exited, status=0/SUCCESS) Main PID: 1997 (pvestatd) Tasks: 1 (limit: 75999) Memory: 104.3M CPU: 2min 10.427s CGroup: /system.slice/pvestatd.service └─1997 pvestatdJul 20 23:39:49 pve systemd[1]: Starting pvestatd.service - PVE Status Daemon...Jul 20 23:39:49 pve pvestatd[1997]: starting serverJul 20 23:39:49 pve systemd[1]: Started pvestatd.service - PVE Status Daemon.Jul 21 03:50:36 pve pvestatd[1997]: status update time (147.569 seconds)root@pve:~# systemctl restart pvestatdAlso, is there a wayto perhaps reaquire the summary page files, perhaps mine gone bonkers (without losing other config files and such)As far as I know, the summary-page is created by the pvestatd service, could you check if it has any errors/warnings in the logs and/or insystemctl status pvestatd, or if restarting that service withsystemctl restart pvestatdhelps?
Last edited:
Didn't help, spinner still stays.Shutdown node (power off) & restart.
Hmm. In my experience the only 2 other things I can think of;
1. The summary page relies heavily on the time state, is the time correct & correctly configured on the node. Check all time services.
2. Is your node fully updated? A mismatch of updates could cause your error.
(BTW, I like your name!)
1. The summary page relies heavily on the time state, is the time correct & correctly configured on the node. Check all time services.
2. Is your node fully updated? A mismatch of updates could cause your error.
(BTW, I like your name!)
Hmm. In my experience the only 2 other things I can think of;
1. The summary page relies heavily on the time state, is the time correct & correctly configured on the node. Check all time services.
2. Is your node fully updated? A mismatch of updates could cause your error.
(BTW, I like your name!)
root@pve:~# date
Sun Jul 21 02:30:24 PM CEST 2024
Seems correct for me.
There is nothing in the pve updates, all seems updated and fine.
looks normal in both places.Does the rest of the GUI work - as expected?
In theDatacenterSummarydoes all appear normal? InDatacenterSearchdoes all uptime etc. correlate with reality?
Updatime is about 35 minutes because of the reboot test.
OK. I was almost stumped by this one - until I took a closer look at the loading spinner image, where I noticed a line "CPU Thermal State". That is not showing through a regular PVE installed system. So you've obviously tweaked/hacked your system to show other custom items. Go back & figure out what has gone wrong with it - and I'm pretty sure your problem will go away.
Ah yeah. Forgot i tried to show host temp on the pve page (using this) https://new.reddit.com/r/homelab/comments/rhq56e/displaying_cpu_temperature_in_proxmox_summery_in/OK. I was almost stumped by this one - until I took a closer look at the loading spinner image, where I noticed a line "CPU Thermal State". That is not showing through a regular PVE installed system. So you've obviously tweaked/hacked your system to show other custom items. Go back & figure out what has gone wrong with it - and I'm pretty sure your problem will go away.
Removed the stuff and pve loads as expected.
Good. Maybe tag prefix the thread-title with [SOLVED], (upper right hand corner under title).


