Proxmox shows wrong stats about memory

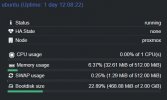
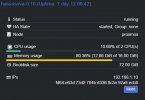
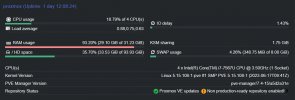
I am having a similar issue to @asmar. The people who jumped on afterwards talk about Windows VM's but this isn't related to Windows VM's. My proxmox node is reporting 29 gigs memory usage, when the CT & VM's only allocate a total of 18 gigs and are reporting to be using 13 gigs. So this is a disparity of at least 11 gigs, if not more (depending your point of view).

See attached screenshots of the summary/totals as well as a few commands below:

Code:
root@proxmox:/var/tmp# free -m
               total        used        free      shared  buff/cache   available
Mem:           31975       29804        1052          60        1117        1684
Swap:           8191         347        7844

Code:
root@proxmox:/var/tmp# cat /proc/meminfo
MemTotal:       32742448 kB
MemFree:         1077204 kB
MemAvailable:    1724024 kB
Buffers:          482812 kB
Cached:           568792 kB
SwapCached:        77524 kB
Active:         10727828 kB
Inactive:        5975228 kB
Active(anon):    9979808 kB
Inactive(anon):  5754120 kB
Active(file):     748020 kB
Inactive(file):   221108 kB
Unevictable:      171620 kB
Mlocked:          171488 kB
SwapTotal:       8388604 kB
SwapFree:        8033020 kB
Dirty:               432 kB
Writeback:             0 kB
AnonPages:      15767060 kB
Mapped:           203588 kB
Shmem:             62092 kB
KReclaimable:      93000 kB
Slab:            2007316 kB
SReclaimable:      93000 kB
SUnreclaim:      1914316 kB
KernelStack:        7456 kB
PageTables:        47240 kB
NFS_Unstable:          0 kB
Bounce:                0 kB
WritebackTmp:          0 kB
CommitLimit:    24759828 kB
Committed_AS:   21602504 kB
VmallocTotal:   34359738367 kB
VmallocUsed:      328456 kB
VmallocChunk:          0 kB
Percpu:             4384 kB
HardwareCorrupted:     0 kB
AnonHugePages:   2510848 kB
ShmemHugePages:        0 kB
ShmemPmdMapped:        0 kB
FileHugePages:         0 kB
FilePmdMapped:         0 kB
HugePages_Total:       0
HugePages_Free:        0
HugePages_Rsvd:        0
HugePages_Surp:        0
Hugepagesize:       2048 kB
Hugetlb:               0 kB
DirectMap4k:     2643496 kB
DirectMap2M:    30789632 kB
DirectMap1G:           0 kB

Code:
root@proxmox:/var/tmp# vmstat -s
     32742448 K total memory
     30526940 K used memory
     10733988 K active memory
      5970972 K inactive memory
      1070720 K free memory
       482924 K buffer memory
       661864 K swap cache
      8388604 K total swap
       355584 K used swap
      8033020 K free swap
      3190710 non-nice user cpu ticks
          277 nice user cpu ticks
      2131722 system cpu ticks
     44981616 idle cpu ticks
       888413 IO-wait cpu ticks
            0 IRQ cpu ticks
        75778 softirq cpu ticks
            0 stolen cpu ticks
     83749139 pages paged in
    257274312 pages paged out
       132034 pages swapped in
       303521 pages swapped out
    450347241 interrupts
    849085830 CPU context switches
   1687607506 boot time
      1762136 forks
 

Attachments

  • 2023-06-26.screenshot (1).jpg
    2023-06-26.screenshot (1).jpg
    79.7 KB · Views: 2
  • 2023-06-26.screenshot (2).jpg
    2023-06-26.screenshot (2).jpg
    76.1 KB · Views: 2
  • 2023-06-26.screenshot (3).jpg
    2023-06-26.screenshot (3).jpg
    83.2 KB · Views: 2
  • 2023-06-26.screenshot.jpg
    2023-06-26.screenshot.jpg
    158.2 KB · Views: 2
Is ZFS used? It's ARC may use up to 50% of your hosts RAM, so in your case up to 16GB. And the ARC is userspace and doesn't count as cache, so it will be listed as "used" by free -h. See output of arc_summary
 
Last edited:
Thanks so much for the reply @Dunuin and so quickly, yes you are correct, I have started using ZFS. See output below:

Code:
root@proxmox:/var/tmp# arc_summary

------------------------------------------------------------------------
ZFS Subsystem Report                            Mon Jun 26 10:38:16 2023
Linux 5.15.108-1-pve                                         2.1.11-pve1
Machine: proxmox (x86_64)                                    2.1.11-pve1

ARC status:                                                      HEALTHY
        Memory throttle count:                                         0

ARC size (current):                                    32.8 %    5.1 GiB
        Target size (adaptive):                        33.0 %    5.2 GiB
        Min size (hard limit):                          6.2 %  999.2 MiB
        Max size (high water):                           16:1   15.6 GiB
        Most Frequently Used (MFU) cache size:         56.2 %    2.7 GiB
        Most Recently Used (MRU) cache size:           43.8 %    2.1 GiB
        Metadata cache size (hard limit):              75.0 %   11.7 GiB
        Metadata cache size (current):                  3.7 %  441.9 MiB
        Dnode cache size (hard limit):                 10.0 %    1.2 GiB
        Dnode cache size (current):                     0.2 %    2.9 MiB

ARC hash breakdown:
        Elements max:                                               3.3M
        Elements current:                              34.5 %       1.1M
        Collisions:                                                 4.6M
        Chain max:                                                     8
        Chains:                                                   129.3k

ARC misc:
        Deleted:                                                    4.1M
        Mutex misses:                                                493
        Eviction skips:                                             3.4k
        Eviction skips due to L2 writes:                               0
        L2 cached evictions:                                     0 Bytes
        L2 eligible evictions:                                  46.9 GiB
        L2 eligible MFU evictions:                     48.9 %   22.9 GiB
        L2 eligible MRU evictions:                     51.1 %   24.0 GiB
        L2 ineligible evictions:                                 5.8 GiB

ARC total accesses (hits + misses):                                31.5M
        Cache hit ratio:                               89.3 %      28.2M
        Cache miss ratio:                              10.7 %       3.4M
        Actual hit ratio (MFU + MRU hits):             89.1 %      28.1M
        Data demand efficiency:                        92.1 %      11.9M
        Data prefetch efficiency:                      16.3 %       2.9M

Cache hits by cache type:
        Most frequently used (MFU):                    62.3 %      17.5M
        Most recently used (MRU):                      37.5 %      10.6M
        Most frequently used (MFU) ghost:               1.5 %     430.2k
        Most recently used (MRU) ghost:                 2.9 %     805.8k

Cache hits by data type:
        Demand data:                                   39.0 %      11.0M
        Prefetch data:                                  1.7 %     469.2k
        Demand metadata:                               59.1 %      16.7M
        Prefetch metadata:                              0.2 %      48.2k

Cache misses by data type:
        Demand data:                                   27.8 %     937.8k
        Prefetch data:                                 71.4 %       2.4M
        Demand metadata:                                0.4 %      14.9k
        Prefetch metadata:                              0.3 %      11.6k

DMU prefetch efficiency:                                            6.3M
        Hit ratio:                                     10.4 %     649.2k
        Miss ratio:                                    89.6 %       5.6M

L2ARC not detected, skipping section

So does that mean that I will be unable to use that RAM now?
 
I am just reading a little now; https://pve.proxmox.com/wiki/ZFS_on_Linux#:~:text=ZFS uses 50 % of the,1 GiB/TiB-Storage.

So if I have 1 TB of ZFS storage on this machine, do you think it would be safe to limit the RAM usage of ZFS to 4GB? I am not sure if it makes any difference being on a cluster, etc.?

For the time being I have changed it to 6GB using the command; echo "$[6 * 1024*1024*1024]" >/sys/module/zfs/parameters/zfs_arc_max

I will see how that goes and then try to work out how to make it permanent if it does work or someone says it is the right thing to do...
 
Last edited:
The important point is the UP TO 50% of the host's RAM. It will also shrink when needed. And free RAM is wasted RAM, so its better to use the RAM for ARC than wasting it by not using it. But the ARC can't be dropped as fast as the normal linux read cache, so it might be useful to limit the ARC when you encounter OOM situations in which case you could limit it.
 
Last edited:
  • Like
Reactions: Spaldo
Thanks, I am getting reboots on the VM I am trying to install, so I was trying to work out if it was a memory issue. I will keep trying a different way, to confirm if it is memory or a totally unrelated issue. If it is the case that I leave the ARC memory at the default and it will go down enough to give me say 8 gigs free for the new VM, then I am happy to leave it and not limit it. Hopefully that makes sense
 
If cat /var/log/syslog | grep oom isn'`t returning anything it shouldn't be low RAM.
 

About

The Proxmox community has been around for many years and offers help and support for Proxmox VE, Proxmox Backup Server, and Proxmox Mail Gateway.
We think our community is one of the best thanks to people like you!

Get your subscription!

The Proxmox team works very hard to make sure you are running the best software and getting stable updates and security enhancements, as well as quick enterprise support. Tens of thousands of happy customers have a Proxmox subscription. Get yours easily in our online shop.

Buy now!