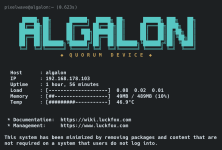
#!/bin/sh
#
# 00-header - Algalon QDevice MOTD
#

# Colors
CYAN="\033[1;36m"
YELLOW="\033[1;33m"
RESET="\033[0m"

printf "\n"
printf "${CYAN}"
cat << 'EOF'
      █████╗ ██╗      ██████╗  █████╗ ██╗      ██████╗ ███╗   ██╗
     ██╔══██╗██║     ██╔════╝ ██╔══██╗██║     ██╔═══██╗████╗  ██║
     ███████║██║     ██║  ███╗███████║██║     ██║   ██║██╔██╗ ██║
     ██╔══██║██║     ██║   ██║██╔══██║██║     ██║   ██║██║╚██╗██║
     ██║  ██║███████╗╚██████╔╝██║  ██║███████╗╚██████╔╝██║ ╚████║
     ╚═╝  ╚═╝╚══════╝ ╚═════╝ ╚═╝  ╚═╝╚══════╝ ╚═════╝ ╚═╝  ╚═══╝
EOF
printf "${RESET}"

printf "${YELLOW}"
cat << 'EOF'
                   ◆  Q U O R U M   D E V I C E  ◆
EOF
printf "${RESET}\n"

# ===== Helper: draw a bar (safe ASCII) =====
draw_bar() {
    PERCENT=$1
    WIDTH=20
    FILLED=$((PERCENT * WIDTH / 100))
    EMPTY=$((WIDTH - FILLED))

    BAR=$(printf "%${FILLED}s" | tr ' ' '#')
    BAR="${BAR}$(printf "%${EMPTY}s" | tr ' ' '-')"
    printf "%s" "$BAR"
}

# ===== Memory (converted to real MB) =====
MEM_USED_MIB=$(free -m | awk '/Mem:/ {print $3}')
MEM_TOTAL_MIB=$(free -m | awk '/Mem:/ {print $2}')
MEM_USED=$(echo "scale=0; $MEM_USED_MIB * 1.048576 / 1" | bc)
MEM_TOTAL=$(echo "scale=0; $MEM_TOTAL_MIB * 1.048576 / 1" | bc)
MEM_PERCENT=$((MEM_USED_MIB * 100 / MEM_TOTAL_MIB))

# ===== Load =====
LOAD1=$(cut -d' ' -f1 /proc/loadavg)
LOAD5=$(cut -d' ' -f2 /proc/loadavg)
LOAD15=$(cut -d' ' -f3 /proc/loadavg)

LOAD_PERCENT=$(echo "$LOAD1 * 33" | bc | cut -d'.' -f1)
[ "$LOAD_PERCENT" -gt 100 ] && LOAD_PERCENT=100

# ===== Temperature =====
TEMP_RAW=$(cat /sys/class/thermal/thermal_zone0/temp 2>/dev/null || echo 0)
TEMP=$(echo "scale=1; $TEMP_RAW / 1000" | bc)
TEMP_PERCENT=$(echo "$TEMP" | cut -d'.' -f1)
[ "$TEMP_PERCENT" -gt 100 ] && TEMP_PERCENT=100

# ===== Output =====
printf "\n"
printf "  Host      : %s\n" "$(hostname)"
printf "  IP        : %s\n" "$(hostname -I | awk '{print $1}')"
printf "  Uptime    : %s\n" "$(uptime -p 2>/dev/null | sed 's/up //')"

printf "  Load      : ["
draw_bar "$LOAD_PERCENT"
printf "]  %s  %s  %s\n" "$LOAD1" "$LOAD5" "$LOAD15"

printf "  Memory    : ["
draw_bar "$MEM_PERCENT"
printf "]  %sMB / %sMB (%s%%)\n" "$MEM_USED" "$MEM_TOTAL" "$MEM_PERCENT"

printf "  Temp      : ["
draw_bar "$TEMP_PERCENT"
printf "]  %s°C\n" "$TEMP"

printf "\n"


 ) All is working well.