Proxmox CPU temp and Using in VMs

bearhntr

Member
Sep 9, 2022
177
15
23
Atlanta, GA USA
I have used may of the ideas in here, and will be looking into the InfluxDB2 Tutorial -- https://forum.proxmox.com/threads/integrating-influxdb2-data-with-temperature-and-disks-info.118615/

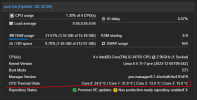
I used the steps here: https://www.reddit.com/r/homelab/comments/rhq56e/displaying_cpu_temperature_in_proxmox_summery_in/


1706719875012.png

with some playing and adjusting - was able to get the CPU Thermal State to show without pushing other monitored data into strange configuration.

❓ Now that I have these values - is there any way to pass them into VMs? or have a VM pull these? I am installing pfSense and HomeAssistant into VMs on Proxmox, and both of them have dashboards that I constantly watch and can show me CPU temps. I am rarely watching my PROXMOX dashboard.
 
The usual way would be to set up some proper monitoring software like zabbix. Then use templates/agents on every PVE host, VM, LXC, switch, router, workstation, client, ... so all metrics get send to the monitoring server. Then you use the webUI of the monitoring software to monitor every devices metrics on a single combined dashboard.
 
The usual way would be to set up some proper monitoring software like zabbix. Then use templates/agents on every PVE host, VM, LXC, switch, router, workstation, client, ... so all metrics get send to the monitoring server. Then you use the webUI of the monitoring software to monitor every devices metrics on a single combined dashboard.
Thanks for the reply, but still a little confused. For example, my current HomeAssistant installation is a stand-alone machine on an HP T620, and I can create a dashboard card within it to see CPU Temp, SMART drive information, Mem Usage, etc. The same for pfSense is on another T620+. I am looking to put them into a PVE host and wanna be able to see these things.

HomeAssistant will let me see the VM RAM and HDD usage - no problems, but not the CPU stuff. Same for pfSense in the PVE host.

I get the use of a 'monitoring' system, and have done a little research on them - just a little 'above' me at the moment. My end goal is to be able to have tablet mounted around the house (specifically for HomeAssistant with a dashboard showing) where I can see the 'condition' of the HA VM host without having to use another computer and go to PVE dashboard.

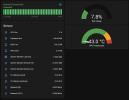
This is the current one I have:
1706730944072.png
 
Last edited:
The usual way would be to set up some proper monitoring software like zabbix. Then use templates/agents on every PVE host, VM, LXC, switch, router, workstation, client, ... so all metrics get send to the monitoring server. Then you use the webUI of the monitoring software to monitor every devices metrics on a single combined dashboard.
Do you have any links or guides on how to do this?
 
  • Like
Reactions: Kingneutron
I also run a Home assistant VM on proxmox - and I show the PVE host temp in Home assistant (HA).

There are 3 (general) ways to go about it:

1. As suggested above - setup a monitoring service to monitor PVE and then "connect" HA to this service.
2. Get HA to directly access PVE using api's and then read its temp from time to time.
3. Get HA to directly access PVE using SSH and then read its temp from time to time.

For option 2 you'll need to setup api's within PVE and then use them in HA.
For option 3 you should setup a pair of ssh keys to use between PVE and HA.

All of the above is not that hard, and even if you're not that familiar with the above - you will definitely learn as you go along!

I believe the easiest is option 3 and I'll leave you an article to get you started:

https://community.home-assistant.io/t/how-to-monitor-proxmox-cpu-temp/245050
 
2. Get HA to directly access PVE using api's and then read its temp from time to time.
PVE isn't collecting temperatures so I don't think you can poll them via PVE API. Then you would need some unofficial opt-in API for that.
 
Just remembered, another option available, would be to have a script (python) running through cron at intervals on the PVE that sends the temp to MQTT. Then setup an MQTT sensor in HA. I did this very successfully for about a year. Today I use the third option (SSH) which I find more versatile - and less changes & meddling within PVE, which is the ultimate goal of proxmox.

There is also another option - (I never went that route) - of running a (cron) python script on PVE for accessing HA by api to send the PVE temp to HA.

@Dunuin is completely correct, that PVE doesn't natively collect temps. I think while trying this route (I can't seem to find my notes when I need them LOL!), I somehow (python script?) made these temps available on PVE.
I must add - I really think temp reading should be natively available both in PVE GUI and by API. (Search the net on this subject - you'll hit a rabbit hole!).
 
Last edited:
I appreciate all the replies from Dunuin / gfngfn256
I have used the following script and have gotten PVE to capture and display the CPU temps and now also the HDD/SSD/NVME temps on the PVE dashboard. Proxmox mods and scripts

After installing the ```lm-sensors``` I do get all sorts of temps, and yes it is not natively there.
```
Feb 04 11:47:28 pve-ha smartd[789]: Configuration file /etc/smartd.conf was parsed, found DEVICESCAN, scanning devices
Feb 04 11:47:28 pve-ha zed[795]: Processing events since eid=0
Feb 04 11:47:28 pve-ha smartd[789]: Device: /dev/sda, type changed from 'scsi' to 'sat'
Feb 04 11:47:28 pve-ha lxcfs[784]: mount namespace: 5
Feb 04 11:47:28 pve-ha lxcfs[784]: hierarchies:
Feb 04 11:47:28 pve-ha lxcfs[784]: 0: fd: 6: cpuset,cpu,io,memory,hugetlb,pids,rdma,misc
Feb 04 11:47:28 pve-ha lxcfs[784]: Kernel supports pidfds
Feb 04 11:47:28 pve-ha lxcfs[784]: Kernel supports swap accounting
Feb 04 11:47:28 pve-ha lxcfs[784]: api_extensions:
Feb 04 11:47:28 pve-ha lxcfs[784]: - cgroups
Feb 04 11:47:28 pve-ha lxcfs[784]: - sys_cpu_online
Feb 04 11:47:28 pve-ha lxcfs[784]: - proc_cpuinfo
Feb 04 11:47:28 pve-ha lxcfs[784]: - proc_diskstats
Feb 04 11:47:28 pve-ha lxcfs[784]: - proc_loadavg
Feb 04 11:47:28 pve-ha lxcfs[784]: - proc_meminfo
Feb 04 11:47:28 pve-ha lxcfs[784]: - proc_stat
Feb 04 11:47:28 pve-ha lxcfs[784]: - proc_swaps
Feb 04 11:47:28 pve-ha lxcfs[784]: - proc_uptime
Feb 04 11:47:28 pve-ha lxcfs[784]: - proc_slabinfo
Feb 04 11:47:28 pve-ha lxcfs[784]: - shared_pidns
Feb 04 11:47:28 pve-ha lxcfs[784]: - cpuview_daemon
Feb 04 11:47:28 pve-ha lxcfs[784]: - loadavg_daemon
Feb 04 11:47:28 pve-ha lxcfs[784]: - pidfds
Feb 04 11:47:28 pve-ha smartd[789]: Device: /dev/sda [SAT], opened
Feb 04 11:47:28 pve-ha sensors[802]: coretemp-isa-0000
Feb 04 11:47:28 pve-ha sensors[802]: Adapter: ISA adapter
Feb 04 11:47:28 pve-ha sensors[802]: Package id 0: +43.0°C (high = +93.0°C, crit = +103.0°C)
Feb 04 11:47:28 pve-ha sensors[802]: Core 0: +32.0°C (high = +93.0°C, crit = +103.0°C)
Feb 04 11:47:28 pve-ha sensors[802]: Core 1: +43.0°C (high = +93.0°C, crit = +103.0°C)
Feb 04 11:47:28 pve-ha sensors[802]: Core 2: +27.0°C (high = +93.0°C, crit = +103.0°C)
Feb 04 11:47:28 pve-ha sensors[802]: Core 3: +29.0°C (high = +93.0°C, crit = +103.0°C)
Feb 04 11:47:28 pve-ha sensors[802]: drivetemp-scsi-1-0
Feb 04 11:47:28 pve-ha sensors[802]: Adapter: SCSI adapter
Feb 04 11:47:28 pve-ha sensors[802]: temp1: +22.0°C
Feb 04 11:47:28 pve-ha sensors[802]: acpitz-acpi-0
Feb 04 11:47:28 pve-ha sensors[802]: Adapter: ACPI interface
Feb 04 11:47:28 pve-ha sensors[802]: temp1: +27.8°C (crit = +104.0°C)
Feb 04 11:47:28 pve-ha sensors[802]: temp2: +29.8°C (crit = +104.0°C)
Feb 04 11:47:28 pve-ha sensors[802]: iwlwifi_1-virtual-0
Feb 04 11:47:28 pve-ha sensors[802]: Adapter: Virtual device
Feb 04 11:47:28 pve-ha sensors[802]: temp1: N/A
Feb 04 11:47:28 pve-ha sensors[802]: drivetemp-scsi-0-0
Feb 04 11:47:28 pve-ha sensors[802]: Adapter: SCSI adapter
Feb 04 11:47:28 pve-ha sensors[802]: temp1: +22.0°C
```

They are there - and I can go to the PVE shell, and type ```sensors``` and get the same values:
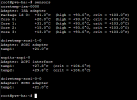
1707066517584.png

I am going to check out the links and suggestions you have provided, they are much appreciated.

As many folks run their systems 'headless' - I feel that being able to display (what I consider critical information about my system) temps and S.M.A.R.T. data on a dashboard - like the one I started building on my 'stand-alone HA box' - a good idea. (I know this is kinda basic, but it was a start). Something like this I would like to have in my PVE installation of HA that I am working on now.
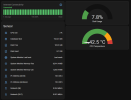
1707066493793.png
 
Last edited:
I also run a Home assistant VM on proxmox - and I show the PVE host temp in Home assistant (HA).

There are 3 (general) ways to go about it:

1. As suggested above - setup a monitoring service to monitor PVE and then "connect" HA to this service.
2. Get HA to directly access PVE using api's and then read its temp from time to time.
3. Get HA to directly access PVE using SSH and then read its temp from time to time.

For option 2 you'll need to setup api's within PVE and then use them in HA.
For option 3 you should setup a pair of ssh keys to use between PVE and HA.

All of the above is not that hard, and even if you're not that familiar with the above - you will definitely learn as you go along!

I believe the easiest is option 3 and I'll leave you an article to get you started:

https://community.home-assistant.io/t/how-to-monitor-proxmox-cpu-temp/245050
what is my HA instance is not on the proxmox VN host but a separate host itself, can i get access to PVE since it is using ssh should not be a problem i guess
 
what is my HA instance is not on the proxmox VN host but a separate host itself, can i get access to PVE since it is using ssh should not be a problem i guess
For sure - as long as you have network access from one to the other (test with ping) you should be able to set it up.
 
what is my HA instance is not on the proxmox VN host but a separate host itself, can i get access to PVE since it is using ssh should not be a problem i guess
i run my lm sensor package in proxmox for temp data . this is the output

acpitz-acpi-0


Adapter: ACPI interface


temp1: +47.0 C


coretemp-isa-0000


Adapter: ISA adapter


Package id 0: +47.0 C (high = +105.0 C, crit = +105.0 C)


Core 0: +47.0 C (high = +105.0 C, crit = +105.0 C)


Core 1: +48.0 C (high = +105.0 C, crit = +105.0 C)


Core 2: +46.0 C (high = +105.0 C, crit = +105.0 C)


Core 3: +46.0 C (high = +105.0 C, crit = +105.0 C)

what should i modify command in sensor yaml line to read it correctly in HA
 
Well as I said above you have 3 basic possibilities to incorporate it into HA. Which option do you want?
 
Thanks for the topic and discussion.

bearhntr What progress has been made in displaying information on tablets at home? Why a tablet? Collecting statistics? Notifications? Or just watch?​

I'm thinking about using Zabbix monitoring software as recommended by Dunuin
I'm learning Unix systems and am at the starting point.
 
Since monitoring Proxmox VE’s temperature is a priority for me, I find this discussion and the various implementation approaches highly insightful. I appreciate everyone's contributions.

That said, I have a broader question on this topic: Why doesn’t Proxmox VE include system temperature KPIs - such as CPU, chipset, and HDD temperatures - within its standard performance monitoring suite (CPU, Memory, Storage, Network)? Given that temperature directly impacts system availability, stability, and overall reliability, wouldn’t its inclusion be highly relevant?

Considering Proxmox's role as a powerful solution for enterprise and production environments, I believe this warrants attention.

What are your thoughts? Has there been any official comment from the Proxmox team on this matter?
 
Last edited:
Considering Proxmox's role as a powerful solution for enterprise and production environments, I believe this warrants attention.
In my experience, specially in those environments, environmental monitoring is already in place by the room and/or by server monitoring via SNMP (idrac, ilo, irmc, etc.). No need to replicate this on the guest OS. Often, the infrastructure team is different from the software service team, so having distinct targets is already a must.
Yet I do understand this requirement for DIY / self-hosted environments, yet just monitor with your favorite monitoring software. I don't see the point in having a webpage, that informs you about this, I want to be informed by not looking at it, but by getting a mail / notification / instant message etc.
 

@LnxBil said:
In my experience, specially in those environments, environmental monitoring is already in place by the room and/or by server monitoring via SNMP (idrac, ilo, irmc, etc.). No need to replicate this on the guest OS. Often, the infrastructure team is different from the software service team, so having distinct targets is already a must.
Indeed. ILO et al are definitely covering this. With regards to infrastructure vs. software team I tend to have a different opinion. As an admin of a VE I would still like to have the full (graphical) picture about the system performance. The technical effort to provide this additional functionality out of the box is rather low.

@LnxBil said:
In my experience, specially in those environments, environmental monitoring is already in place by the room and/or by server monitoring via SNMP (idrac, ilo, irmc, etc.). No need to replicate this on the guest OS. Often, the infrastructure team is different from the software service team, so having distinct targets is already a must.
Yet I do understand this requirement for DIY / self-hosted environments, yet just monitor with your favorite monitoring software. I don't see the point in having a webpage, that informs you about this, I want to be informed by not looking at it, but by getting a mail / notification / instant message etc.
Agreed. Especially as those DIY environments (maybe even some SMB environments) are usually not controlled environments. Dust, changing room temperatures (no AC) can easily have negative effects short- and long term. Notifications are definitely a must, but as stated above, a graphical display of logged data would still be important to me.
 
Last edited:
  • Like
Reactions: vandariu
Notifications are definitely a must, but as stated above, a graphical display of logged data would still be important to me.
I agree - you have my vote. Would definitely be useful. I believe it has been discussed before on these forums - but for some reason hasn't had much traction. I think some users have DIYed their GUI to show this data. But I think PVE should offer this in-house.
 
  • Like
Reactions: vandariu
I think some users have DIYed their GUI to show this data. But I think PVE should offer this in-house.
If it's only one thing that I learned in all those years working with different VEs - it is "don't tinker with it". Using the (advanced) functionalities including APIs to the max is ok, but never tinker with the standard. I have learned this the hard way. So, as much as I appreciate the DIY solutions in this forum, I still won't open this box again. I would rather like this to become an official Proxmox feature through the proper channels.

As I am pretty new to this forum - what is the appropriate way to draw the Proxomox staff's attention to this topic/thread/feature request?
 
Last edited: