ProxMox 4.x is killing my SSDs

hybrid512

Active Member
Jun 6, 2013
76
4
28
Hi,

Sorry for the provocative punchline but there is something really strange going on here ...

I'm running ProxMox 4.3 but since my migration to ProxMox 4 (I was happily running a ProxMox 3 cluster before ...), I have a very weird (and dangerous) behaviour with ProxMox installed on SSDs.

So, to be clear, I'm running ProxMox in cluster mode (currently 14 nodes) with servers equipped that way :
  • 1x little SATA SSD drive with base ProxMox installation but used for nothing except the system itself (not used for local storage or LVM Thin)
  • 4x SAS 15k drives used as OSDs for CEPH

I was using the exact same setup for more than a year with ProxMox 3 with no problem.
Since I migrated to ProxMox 4, my SSDs began to fail one after the other just a few months later.
At first, I thought it was a bad SSDs batch and I returned nearly half of it for RMA.
While sending back those disks, I replaced them with new ones, some Corsair, some Samsung.

Since Corsair was the brand of the faulty disks, I monitorized them regularly and saw the SMART 231/SSD_Life_Left value going down slowly but since I thought they were pretty bad disks ... I didn't pay too much attention since I'm replacing them with Intel DC S3520 soon.

What really got my attention was the Samsung 830 I used to replace a faulty disk.
It was a new disk, freshly unboxed that was never used.
I know this is not a "Pro" disk but I already used many of those disks in many different situations and they are quite robust.
I installed it in my node about 2 months ago and guess what ? It is already at 10% wearout !!
10% !! In 2 months !!

I don't understand why it is like this ... there is nearly no activity on those disks, only log files and my whole /var/log accounts for under 100MB which is not enough to kill a SSD, even a bad one.

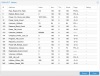
The only activity I see with iotop is this :
Code:
Total DISK READ :       3.16 K/s | Total DISK WRITE :       4.67 M/s
Actual DISK READ:       3.16 K/s | Actual DISK WRITE:       4.93 M/s
  TID  PRIO  USER     DISK READ  DISK WRITE  SWAPIN     IO>    COMMAND                                                                                                                                             
  789 be/3 root        0.00 B/s   15.39 K/s  0.00 %  4.29 % [jbd2/dm-0-8]
4912 be/4 root        0.00 B/s    2.38 M/s  0.00 %  1.01 % ceph-mon -i 2 --pid-file /var/run/ceph/mon.2.pid -c /etc/ceph/ceph.conf --cluster ceph -f
4445 be/4 root        0.00 B/s   96.70 K/s  0.00 %  0.08 % ceph-mon -i 2 --pid-file /var/run/ceph/mon.2.pid -c /etc/ceph/ceph.conf --cluster ceph -f
1989 be/0 root        0.00 B/s    0.00 B/s  0.00 %  0.07 % dmeventd -f
38396 be/4 root      808.30 B/s    0.00 B/s  0.00 %  0.04 % ceph-osd -i 8 --pid-file /var/run/ceph/osd.8.pid -c /etc/ceph/ceph.conf --cluster ceph -f
5487 be/4 root      808.30 B/s    0.00 B/s  0.00 %  0.04 % ceph-osd -i 7 --pid-file /var/run/ceph/osd.7.pid -c /etc/ceph/ceph.conf --cluster ceph -f
38359 be/4 root        0.00 B/s  808.30 B/s  0.00 %  0.02 % ceph-osd -i 8 --pid-file /var/run/ceph/osd.8.pid -c /etc/ceph/ceph.conf --cluster ceph -f
5369 be/4 root        0.00 B/s 1212.45 B/s  0.00 %  0.01 % ceph-osd -i 6 --pid-file /var/run/ceph/osd.6.pid -c /etc/ceph/ceph.conf --cluster ceph -f
5094 be/4 root        0.00 B/s  808.30 B/s  0.00 %  0.01 % ceph-osd -i 7 --pid-file /var/run/ceph/osd.7.pid -c /etc/ceph/ceph.conf --cluster ceph -f

The "[jbd2/dm-0-8]" process is always on top of the list and eating the most of the ios but still ... this is not much, under 5% most of the time.
Other processes concerns mostly ceph but ceph OSDs are not the SSD and I don't use the SSD as journaling disk.
As I said ... only logs are written on this disk.

Any idea ?
Is there a way to preserve my SSDs or do I have to replace them with mechanical hard drives ??

Best regards.
 
I would like to precise that the SSD is Ext4 formated with default settings.
If I remember, ProxMox 3 defaulted to Ext3.
 
Hi hybrid512,

I found your thread while googling for answers for similar issues (I searched for "Promox killing my hard disks" BTW).

My current Proxmox 4.3 Cluster setup is for testing purposes and I am facing similar issues.
  • 1 x Master (1 x SSD each)
  • 4 x Slaves (1 x SSD each)
I am currently using Crucial SSDs, and I've never had a single problem with them before. However, my Proxmox Master just suddenly failed with an error on screen and no longer boots, which resulted in a cluster issue. While troubleshooting issues related to corosync/networking, I had to reboot one of the Slaves. Unfortunately, it seems like the last Slave just died and became non bootable too.
 
Code:
root@X5:~# w
-bash: /usr/bin/w: Input/output error
root@X5:~# w
-bash: /usr/bin/w: Input/output error
root@X5:~# uptime
-bash: /usr/bin/uptime: Input/output error

so another Slave just died and became non bootable.
 
I always have on my private pvemachine 2 SSDs on Raid1 (ZFS) only for the system. Really cheap SSDs €19,- (Kingston) for one. And they run 492days to now. No Problem. They are monitored with check_mk and yes they have some CRC-Errors.

Your situation is really strange. I very interessting about that issue.
 
I'm also interested in this problem.
Have you been using TRIM the whole time (older and/or newer Proxmox VE version)? Have you monitored your SSDs via smart before so that you can relate to the previous Proxmox VE version?
 
2x raid 10 - 4x samsung 850pro, lvm thin
connected to H700 so no trim support.

SSD 0 write: 5.67 TB power_on: 391.6 days wear_index: 099 Full_write:27 bad_sector: 0 serial:S250NXAGB02245X
SSD 1 write: 6.06 TB power_on: 391.6 days wear_index: 099 Full_write:25 bad_sector: 0 serial:S250NXAGB02250E
SSD 2 write: 5.50 TB power_on: 341.9 days wear_index: 099 Full_write:26 bad_sector: 0 serial:S250NXAGB02262M
SSD 3 write: 5.89 TB power_on: 341.9 days wear_index: 099 Full_write:23 bad_sector: 0 serial:S250NXAGB02242Y

SSD 0 write: 3.39 TB power_on: 331.5 days wear_index: 099 Full_write:29 bad_sector: 0 serial:S250NXAGB02261B
SSD 1 write: 3.40 TB power_on: 331.5 days wear_index: 099 Full_write:29 bad_sector: 0 serial:S250NXAGB02253J
SSD 2 write: 3.06 TB power_on: 381.0 days wear_index: 099 Full_write:23 bad_sector: 0 serial:S250NXAGB02249D
SSD 3 write: 3.07 TB power_on: 381.0 days wear_index: 099 Full_write:24 bad_sector: 0 serial:S250NXAGB02259Z
 
Here is a screen capture from the SMART values taken from one of my nodes.
This node's SSD failed 2 weeks ago and I replaced it with a brand new disk 7 days ago only.
As you can see, SSD_Life_Left value is at 99 which is good (you must read it reverse as the Wearout value you find on Samsung's SSDs) but it is in use for only 7 days old and it already wrote 399 GiB !! In 7 days !!
How can it be ?
There is no stored data on this disk, only system logs, ceph logs and everything sys only related, storage is done elsewhere so how can it be possible to write nearly 400GiB of data in just a few days ??
Not surprising that those SSDs lifetime is so short ...

Any idea ?
 

Attachments

  • Capture du 2016-10-11 12-00-41.png
    Capture du 2016-10-11 12-00-41.png
    66.2 KB · Views: 101
I would add that there is definitely a problem there ... I lost 2 more drives recently ... on a batch of 15 disks, I lost 8 of them ... that's far too much for a coincidence ...
As I said, I was running the exact same setup with ProxMox 3 (SSD as OS disk, SAS drives as Ceph OSDs, nothing stored on SSDs except logs and sys stuff) and I never lost a drive in more than a year.
There is definitely something that happened in the move to ProxMox 4 (kernel, ext4 instead of ext3, new processes, <drop anything that comes to your mind> ...)
 
My SSDs are directly attached on the internal SATA port of the server, no RAID controller in between.
 
Please record with dstat or iostat over a longer period of time. iotop would also be good with aggregated monitoring.

How many VMs are you using? Maybe it's the monitoring and performance data of Proxmox VE?
 
I just changed a new SSD, this is a brand new one, I will monitor it closely to get more informations.

To answer your question, what do you mean by "How many VMs I use" ? Do you mean cluster wide or per node ?
On this node I had about 6 VMs but cluster wide, I have currently about 100 running VMs.
 
I suppose it might be continuous writing of logs to disk, which might be killing SSD as this causes quite high write amplification (for adding a few bytes of logs you might have to write actually a few MB data, depending on SSD erase block size). iostat/iotop might show low values, as it counts "real" OS-level writing, but not the work SSD-controller has to do...

Increasing log-buffer could help here, so that logs are written in batches (while accepting the risk you might loose some logs in case of power-failure).
 
Sorry, but logging is (generally) out of question. You need to have hundreds of messages per second to reach gigabyte of data in hours. If you're logging that much, something is going very wrong and you should investigate.
And the horrendous write amplification of a few bytes to MB is hopefully not true. If so, go and buy a decent SSD without this "broken-by-design"-flaw. Have you experienced this behavior on some models? If so, what models are affected?
 
For instance, most of my SSDs are cheap Corsair Force LS 60GB but I added a Samsung 750 on another node nearly 5 months ago and it is at 1% Wearout.
Might be a problem related to this model precisely ... I purchased Intel DC S3520 SSDs to replace them all ... I'll check them to see if it behaves the same way or not.

I must say that my Samsung SSD is in a node that is not part of the Ceph cluster, only client ... dunno if that changes anything.
 
FWIW, we've yet to have an Intel SSD fail in any of our nodes, or other servers for that matter. So, it is likely a problem with the SSDs themselves.
 
SSDs can write many TBs before they fail. It's very unlikely, bordering impossible, that the disk that proxmox lives on has written this much data in such a short space of time.
 
SSDs can write many TBs before they fail. It's very unlikely, bordering impossible, that the disk that proxmox lives on has written this much data in such a short space of time.

[URL='https://forum.proxmox.com/members/hybrid512.25277/']hybrid512[/URL] said:
This node's SSD failed 2 weeks ago and I replaced it with a brand new disk 7 days ago only.
As you can see, SSD_Life_Left value is at 99 which is good (you must read it reverse as the Wearout value you find on Samsung's SSDs) but it is in use for only 7 days old and it already wrote 399 GiB !! In 7 days !!


We are talking 57 GiB/Day, which comes down to
  • 0,67 Mebibyte/s
  • 5,4 Mebibit/s

Not sure what exactly is generating these amounts of data on your SSD's, but it for sure should stick out when you are tracking it down via iotop, iostat and the likes.
 
...And the horrendous write amplification of a few bytes to MB is hopefully not true. If so, go and buy a decent SSD without this "broken-by-design"-flaw. Have you experienced this behavior on some models? If so, what models are affected?

Honestly man, I think you should read something about SSD (i.e. wikipedia has nice article about "write amplification"). Call it "broken by design", but write amplification is common feature of every flash memory due to way it works: before writing to flash memory, you have to erase it (which counts as writing). And this is done in so called "erase-blocks", which is much bigger unit than "sector" (typical erase-block size ranges from 128kB up to 4MB, depending on vendor and ssd-size).

You might want to write just 100bytes of data (be it log-message or whatever), but if you write it to SSD (which has none never-written-to blocks), you actually have to write at least 128kB. All SSDs are affected by this, albeit some more than others (depends on erase-block size, controller logic, etc). This write amplification factor can be quite high when writing small files, but close to 1 for big files. But is never 1! It means, it does not matter how much data OS wrote to disk (iotop, iostat, etc). What does matter is how much data wrote ssd-controller actually to ssd (value you can find in SMART table).

SSD-controller tries to fight this problem by "garbage collection", "wear leveling", sequential writes, etc. Moreover, there are ways how user can help:
1. do not write in small chunks (i.e. log-files line-by-line)
2. have plenty of free/overprovisioned space (I recommend 20-25%)
3. fire up trim command regularly
 
Last edited:
  • Like
Reactions: sigxcpu

About

The Proxmox community has been around for many years and offers help and support for Proxmox VE, Proxmox Backup Server, and Proxmox Mail Gateway.
We think our community is one of the best thanks to people like you!

Get your subscription!

The Proxmox team works very hard to make sure you are running the best software and getting stable updates and security enhancements, as well as quick enterprise support. Tens of thousands of happy customers have a Proxmox subscription. Get yours easily in our online shop.

Buy now!