problems with Gigabyte GA-P55m-UD2

tesquenure

Member
Aug 18, 2009
109
1
16
Hi,

Strange freezing with a Gigabyte GA-P55m-UD2.
- Gigabyte GA-P55m-UD2
- Intel I5
- 2 HDD 500GO
- 8 GO DDR3
- PVE 1.4 up to date.
- 1 KVM

I really don't understand what's happen.

But after 30mn or 1h i have a ping freeze, not loosing packets, but ping with 18ms on VM and 9ms on eth0. After 10 mn all became normal.

top dont chow me overload on PVE and VM.

During the freeze usb keyboard on PVE double character on type.

After reading this http://www.proxmox.com/forum/showthread.php?t=2489

I use a 3COM network card and turn of mother boar card.

Same result.

Already changing motherboard and testmem is ok.
I try this on tow sites, changing switch and network cable.

I use my VM on a other PVE and all rocks (CORE 2 DUO server)

Code:
lspci -v | grep -i "Ethernet"
04:00.0 Ethernet controller: Realtek Semiconductor Co., Ltd. RTL8111/8168B PCI Express Gigabit Ethernet controller (rev 03)
05:02.0 Ethernet controller: 3Com Corporation 3c905C-TX/TX-M [Tornado] (rev 78)
Code:
pveperf 
CPU BOGOMIPS:      21321.69
REGEX/SECOND:      790201
HD SIZE:           94.49 GB (/dev/pve/root)
BUFFERED READS:    112.03 MB/sec
AVERAGE SEEK TIME: 9.02 ms
FSYNCS/SECOND:     935.04
DNS EXT:           462.29 ms
DNS INT:           921.33 ms
Code:
pveversion -v
pve-manager: 1.4-9 (pve-manager/1.4/4390)
qemu-server: 1.1-8
pve-kernel: 2.6.24-16
pve-qemu-kvm: 0.11.0-2
pve-firmware: 1
vncterm: 0.9-2
vzctl: 3.0.23-1pve3
vzdump: 1.2-5
vzprocps: 2.0.11-1dso2
vzquota: 3.0.11-1
any suggestions are well come
 
  1. Do not turn off the mainboard LAN.
  2. Use another PCI socket for your second NIC.
  3. Check your lspci -v (get the full stanzas for your Ethernet cards).
  4. Run udevinfo -a -p /sys/class/net/eth0
  5. Run udevinfo -a -p /sys/class/net/eth1
  6. Edit your /etc/udev/rules.d/70-persistent-net.rules to suit your environment using info from 4 and 5 above.
  7. Create / Edit your /etc/network/interfaces to suit your needs.
  8. Reboot!
Code:
[B]# cat /etc/network/interfaces[/B]

# network interface settings
auto lo
iface lo inet loopback

iface eth0 inet manual

iface eth1 inet manual

auto vmbr0
iface vmbr0 inet static
    address  192.168.10.100
    netmask  255.255.255.0
    gateway  192.168.10.1
    broadcast  192.168.10.255
    bridge_ports eth0
    bridge_stp off
    bridge_fd 0
    network  192.168.10.0

auto vmbr1
iface vmbr1 inet static
    address  10.10.10.100
    netmask  255.255.255.0
    broadcast  10.10.10.255
    bridge_ports eth1
    bridge_stp off
    bridge_fd 0
Kindly note that the initial indents are TABS and not SPACES.
 
Last edited:
apmuthu,

My problem appeared before I put the 2nd network nic.
The 2nd nic added for tests.

Code:
lspci -v
04:00.0 Ethernet controller: Realtek Semiconductor Co., Ltd. RTL8111/8168B PCI Express Gigabit Ethernet controller (rev 03)
    Subsystem: Giga-byte Technology GA-EP45-DS5 Motherboard
    Flags: bus master, fast devsel, latency 0, IRQ 2299
    I/O ports at de00 [size=256]
    Memory at fbeff000 (64-bit, prefetchable) [size=4K]
    Memory at fbef8000 (64-bit, prefetchable) [size=16K]
    [virtual] Expansion ROM at fbe00000 [disabled] [size=128K]
    Capabilities: [40] Power Management version 3
    Capabilities: [50] Message Signalled Interrupts: Mask- 64bit+ Queue=0/0 Enable+
    Capabilities: [70] Express Endpoint, MSI 01
    Capabilities: [ac] MSI-X: Enable- Mask- TabSize=4
    Capabilities: [cc] Vital Product Data <?>
    Kernel driver in use: r8169
    Kernel modules: r8169

05:02.0 Ethernet controller: 3Com Corporation 3c905C-TX/TX-M [Tornado] (rev 78)
    Subsystem: 3Com Corporation 3C905CX-TX/TX-M Fast Etherlink for PC Management NIC
    Flags: bus master, medium devsel, latency 64, IRQ 18
    I/O ports at bf00 [size=128]
    Memory at fbcff000 (32-bit, non-prefetchable) [size=128]
    [virtual] Expansion ROM at fbc00000 [disabled] [size=128K]
    Capabilities: [dc] Power Management version 2
    Kernel driver in use: 3c59x
    Kernel modules: 3c59x
Code:
 udevinfo -a -p /sys/class/net/eth4

Udevinfo starts with the device specified by the devpath and then
walks up the chain of parent devices. It prints for every device
found, all possible attributes in the udev rules key format.
A rule to match, can be composed by the attributes of the device
and the attributes from one single parent device.

  looking at device '/devices/pci0000:00/0000:00:1c.5/0000:04:00.0/net/eth4':
    KERNEL=="eth4"
    SUBSYSTEM=="net"
    DRIVER==""
    ATTR{addr_len}=="6"
    ATTR{iflink}=="2"
    ATTR{ifindex}=="2"
    ATTR{features}=="0x180"
    ATTR{type}=="1"
    ATTR{link_mode}=="0"
    ATTR{address}=="00:24:1d:d6:83:b3"
    ATTR{broadcast}=="ff:ff:ff:ff:ff:ff"
    ATTR{carrier}=="1"
    ATTR{dormant}=="0"
    ATTR{operstate}=="up"
    ATTR{mtu}=="1500"
    ATTR{flags}=="0x1103"
    ATTR{tx_queue_len}=="1000"

  looking at parent device '/devices/pci0000:00/0000:00:1c.5/0000:04:00.0/net':
    KERNELS=="net"
    SUBSYSTEMS==""
    DRIVERS==""

  looking at parent device '/devices/pci0000:00/0000:00:1c.5/0000:04:00.0':
    KERNELS=="0000:04:00.0"
    SUBSYSTEMS=="pci"
    DRIVERS=="r8169"
    ATTRS{vendor}=="0x10ec"
    ATTRS{device}=="0x8168"
    ATTRS{subsystem_vendor}=="0x1458"
    ATTRS{subsystem_device}=="0xe000"
    ATTRS{class}=="0x020000"
    ATTRS{irq}=="2299"
    ATTRS{local_cpus}=="00000000,00000000"
    ATTRS{modalias}=="pci:v000010ECd00008168sv00001458sd0000E000bc02sc00i00"
    ATTRS{numa_node}=="-1"
    ATTRS{enable}=="1"
    ATTRS{broken_parity_status}=="0"
    ATTRS{msi_bus}==""

  looking at parent device '/devices/pci0000:00/0000:00:1c.5':
    KERNELS=="0000:00:1c.5"
    SUBSYSTEMS=="pci"
    DRIVERS=="pcieport-driver"
    ATTRS{vendor}=="0x8086"
    ATTRS{device}=="0x3b4c"
    ATTRS{subsystem_vendor}=="0x0000"
    ATTRS{subsystem_device}=="0x0000"
    ATTRS{class}=="0x060400"
    ATTRS{irq}=="2300"
    ATTRS{local_cpus}=="00000000,00000000"
    ATTRS{modalias}=="pci:v00008086d00003B4Csv00000000sd00000000bc06sc04i00"
    ATTRS{numa_node}=="-1"
    ATTRS{enable}=="2"
    ATTRS{broken_parity_status}=="0"
    ATTRS{msi_bus}=="1"

  looking at parent device '/devices/pci0000:00':
    KERNELS=="pci0000:00"
    SUBSYSTEMS==""
    DRIVERS==""
Code:
udevinfo -a -p /sys/class/net/eth3

Udevinfo starts with the device specified by the devpath and then
walks up the chain of parent devices. It prints for every device
found, all possible attributes in the udev rules key format.
A rule to match, can be composed by the attributes of the device
and the attributes from one single parent device.

  looking at device '/devices/pci0000:00/0000:00:1e.0/0000:05:02.0/net/eth3':
    KERNEL=="eth3"
    SUBSYSTEM=="net"
    DRIVER==""
    ATTR{addr_len}=="6"
    ATTR{iflink}=="3"
    ATTR{ifindex}=="3"
    ATTR{features}=="0x3"
    ATTR{type}=="1"
    ATTR{link_mode}=="0"
    ATTR{address}=="00:0a:5e:3e:d5:9b"
    ATTR{broadcast}=="ff:ff:ff:ff:ff:ff"
    ATTR{carrier}=="0"
    ATTR{dormant}=="0"
    ATTR{operstate}=="down"
    ATTR{mtu}=="1500"
    ATTR{flags}=="0x1103"
    ATTR{tx_queue_len}=="1000"

  looking at parent device '/devices/pci0000:00/0000:00:1e.0/0000:05:02.0/net':
    KERNELS=="net"
    SUBSYSTEMS==""
    DRIVERS==""

  looking at parent device '/devices/pci0000:00/0000:00:1e.0/0000:05:02.0':
    KERNELS=="0000:05:02.0"
    SUBSYSTEMS=="pci"
    DRIVERS=="3c59x"
    ATTRS{vendor}=="0x10b7"
    ATTRS{device}=="0x9200"
    ATTRS{subsystem_vendor}=="0x10b7"
    ATTRS{subsystem_device}=="0x1000"
    ATTRS{class}=="0x020000"
    ATTRS{irq}=="18"
    ATTRS{local_cpus}=="00000000,00000000"
    ATTRS{modalias}=="pci:v000010B7d00009200sv000010B7sd00001000bc02sc00i00"
    ATTRS{numa_node}=="-1"
    ATTRS{enable}=="2"
    ATTRS{broken_parity_status}=="0"
    ATTRS{msi_bus}==""

  looking at parent device '/devices/pci0000:00/0000:00:1e.0':
    KERNELS=="0000:00:1e.0"
    SUBSYSTEMS=="pci"
    DRIVERS==""
    ATTRS{vendor}=="0x8086"
    ATTRS{device}=="0x244e"
    ATTRS{subsystem_vendor}=="0x0000"
    ATTRS{subsystem_device}=="0x0000"
    ATTRS{class}=="0x060401"
    ATTRS{irq}=="0"
    ATTRS{local_cpus}=="00000000,00000000"
    ATTRS{modalias}=="pci:v00008086d0000244Esv00000000sd00000000bc06sc04i01"
    ATTRS{numa_node}=="-1"
    ATTRS{enable}=="1"
    ATTRS{broken_parity_status}=="0"
    ATTRS{msi_bus}=="1"

  looking at parent device '/devices/pci0000:00':
    KERNELS=="pci0000:00"
    SUBSYSTEMS==""
    DRIVERS==""
Code:
nano /etc/udev/rules.d/70-persistent-net.rules
# This file was automatically generated by the /lib/udev/write_net_rules
# program run by the persistent-net-generator.rules rules file.
#
# You can modify it, as long as you keep each rule on a single line.

# PCI device 0x10ec:0x8168 (r8169)
SUBSYSTEM=="net", ACTION=="add", DRIVERS=="?*", ATTR{address}=="00:24:1d:d3:2d:37", ATTR{type}=="1", KERNEL=="eth*", NAME="eth0"

# PCI device 0x1186:0x4b01 (skge)
SUBSYSTEM=="net", ACTION=="add", DRIVERS=="?*", ATTR{address}=="00:15:e9:3d:90:e6", ATTR{type}=="1", KERNEL=="eth*", NAME="eth1"

# PCI device 0x10ec:0x8139 (8139too)
SUBSYSTEM=="net", ACTION=="add", DRIVERS=="?*", ATTR{address}=="00:30:4f:68:f9:2f", ATTR{type}=="1", KERNEL=="eth*", NAME="eth2"

# PCI device 0x10b7:0x9200 (3c59x)
SUBSYSTEM=="net", ACTION=="add", DRIVERS=="?*", ATTR{address}=="00:0a:5e:3e:d5:9b", ATTR{type}=="1", KERNEL=="eth*", NAME="eth3"

# PCI device 0x10ec:0x8168 (r8169)
SUBSYSTEM=="net", ACTION=="add", DRIVERS=="?*", ATTR{address}=="00:24:1d:d6:83:b3", ATTR{type}=="1", KERNEL=="eth*", NAME="eth4"
Code:
nano /etc/network/interfaces
# network interface settings
auto lo
iface lo inet loopback

iface eth0 inet manual

iface eth3 inet manual

iface eth4 inet manual

auto vmbr0
iface vmbr0 inet static
        address  192.168.1.99
        netmask  255.255.255.0
        gateway  192.168.1.20
        bridge_ports eth4
        bridge_stp off
        bridge_fd 0

auto vmbr1
iface vmbr1 inet static
        address  192.168.1.77
        netmask  255.255.255.0
        bridge_ports eth3
        bridge_stp off
        bridge_fd 0
Not very clean, but problem became befor that.
 
Hi,

After some tests :
- Reinstall PVE 1.4
- Update
- Restore a VM

VM is idel
Monitoring :

Ping from PVE to VM

Code:
64 bytes from 192.168.1.111: icmp_seq=10 ttl=64 time=0.215 ms
64 bytes from 192.168.1.111: icmp_seq=11 ttl=64 time=0.178 ms
64 bytes from 192.168.1.111: icmp_seq=12 ttl=64 time=0.366 ms
64 bytes from 192.168.1.111: icmp_seq=13 ttl=64 time=0.278 ms
64 bytes from 192.168.1.111: icmp_seq=14 ttl=64 time=21.7 ms
64 bytes from 192.168.1.111: icmp_seq=15 ttl=64 time=19.3 ms
64 bytes from 192.168.1.111: icmp_seq=16 ttl=64 time=10.3 ms
64 bytes from 192.168.1.111: icmp_seq=17 ttl=64 time=44.9 ms
64 bytes from 192.168.1.111: icmp_seq=18 ttl=64 time=0.265 ms
64 bytes from 192.168.1.111: icmp_seq=19 ttl=64 time=21.1 ms
64 bytes from 192.168.1.111: icmp_seq=20 ttl=64 time=29.2 ms
64 bytes from 192.168.1.111: icmp_seq=21 ttl=64 time=19.3 ms
64 bytes from 192.168.1.111: icmp_seq=22 ttl=64 time=20.7 ms
64 bytes from 192.168.1.111: icmp_seq=23 ttl=64 time=39.6 ms
64 bytes from 192.168.1.111: icmp_seq=24 ttl=64 time=0.345 ms
64 bytes from 192.168.1.111: icmp_seq=25 ttl=64 time=10.0 ms
64 bytes from 192.168.1.111: icmp_seq=26 ttl=64 time=12.7 ms
64 bytes from 192.168.1.111: icmp_seq=27 ttl=64 time=10.1 ms
64 bytes from 192.168.1.111: icmp_seq=28 ttl=64 time=11.5 ms
64 bytes from 192.168.1.111: icmp_seq=29 ttl=64 time=0.074 ms
64 bytes from 192.168.1.111: icmp_seq=30 ttl=64 time=19.5 ms
64 bytes from 192.168.1.111: icmp_seq=31 ttl=64 time=14.4 ms
64 bytes from 192.168.1.111: icmp_seq=32 ttl=64 time=21.1 ms
64 bytes from 192.168.1.111: icmp_seq=33 ttl=64 time=36.6 ms
64 bytes from 192.168.1.111: icmp_seq=34 ttl=64 time=5.84 ms
64 bytes from 192.168.1.111: icmp_seq=35 ttl=64 time=5.88 ms
64 bytes from 192.168.1.111: icmp_seq=36 ttl=64 time=0.230 ms
64 bytes from 192.168.1.111: icmp_seq=37 ttl=64 time=1.38 ms
64 bytes from 192.168.1.111: icmp_seq=38 ttl=64 time=24.9 ms
64 bytes from 192.168.1.111: icmp_seq=39 ttl=64 time=0.256 ms
64 bytes from 192.168.1.111: icmp_seq=40 ttl=64 time=25.7 ms
64 bytes from 192.168.1.111: icmp_seq=41 ttl=64 time=17.6 ms
64 bytes from 192.168.1.111: icmp_seq=42 ttl=64 time=0.862 ms
64 bytes from 192.168.1.111: icmp_seq=43 ttl=64 time=5.34 ms
64 bytes from 192.168.1.111: icmp_seq=44 ttl=64 time=13.6 ms
64 bytes from 192.168.1.111: icmp_seq=45 ttl=64 time=1.22 ms
64 bytes from 192.168.1.111: icmp_seq=46 ttl=64 time=19.6 ms
64 bytes from 192.168.1.111: icmp_seq=47 ttl=64 time=2.41 ms
64 bytes from 192.168.1.111: icmp_seq=48 ttl=64 time=12.0 ms
64 bytes from 192.168.1.111: icmp_seq=49 ttl=64 time=0.170 ms
64 bytes from 192.168.1.111: icmp_seq=50 ttl=64 time=9.55 ms
64 bytes from 192.168.1.111: icmp_seq=51 ttl=64 time=6.86 ms
64 bytes from 192.168.1.111: icmp_seq=52 ttl=64 time=8.69 ms
64 bytes from 192.168.1.111: icmp_seq=53 ttl=64 time=19.8 ms
64 bytes from 192.168.1.111: icmp_seq=54 ttl=64 time=4.27 ms
64 bytes from 192.168.1.111: icmp_seq=55 ttl=64 time=19.6 ms
64 bytes from 192.168.1.111: icmp_seq=56 ttl=64 time=2.59 ms
64 bytes from 192.168.1.111: icmp_seq=57 ttl=64 time=0.558 ms
64 bytes from 192.168.1.111: icmp_seq=58 ttl=64 time=1.94 ms
64 bytes from 192.168.1.111: icmp_seq=59 ttl=64 time=2.55 ms
64 bytes from 192.168.1.111: icmp_seq=60 ttl=64 time=0.212 ms
64 bytes from 192.168.1.111: icmp_seq=61 ttl=64 time=4.86 ms
64 bytes from 192.168.1.111: icmp_seq=62 ttl=64 time=0.559 ms
64 bytes from 192.168.1.111: icmp_seq=63 ttl=64 time=24.8 ms
64 bytes from 192.168.1.111: icmp_seq=64 ttl=64 time=5.05 ms
64 bytes from 192.168.1.111: icmp_seq=65 ttl=64 time=34.8 ms
64 bytes from 192.168.1.111: icmp_seq=66 ttl=64 time=13.7 ms
64 bytes from 192.168.1.111: icmp_seq=67 ttl=64 time=1.19 ms
64 bytes from 192.168.1.111: icmp_seq=68 ttl=64 time=27.0 ms
64 bytes from 192.168.1.111: icmp_seq=69 ttl=64 time=8.98 ms
64 bytes from 192.168.1.111: icmp_seq=70 ttl=64 time=18.8 ms
64 bytes from 192.168.1.111: icmp_seq=71 ttl=64 time=32.2 ms
64 bytes from 192.168.1.111: icmp_seq=72 ttl=64 time=9.16 ms
64 bytes from 192.168.1.111: icmp_seq=73 ttl=64 time=0.167 ms
64 bytes from 192.168.1.111: icmp_seq=74 ttl=64 time=22.2 ms
64 bytes from 192.168.1.111: icmp_seq=75 ttl=64 time=20.8 ms

--- 192.168.1.111 ping statistics ---
75 packets transmitted, 75 received, 0% packet loss, time 101828ms
rtt min/avg/max/mdev = 0.074/10.742/44.917/11.332 ms
At the same time

Code:
dstat -cdnsil -D sda -N eth0
----total-cpu-usage---- --dsk/sda-- --net/eth0- -swp/total- -interrupts ---load-avg---
usr sys idl wai hiq siq| read  writ| recv  send| used  free| 2298  2299| 1m   5m  15m 
  3   2  95   0   0   0|8192B   52k| 604B 1870B|   0  7168M|  13     9 | 0.4  0.3  0.2
  2   3  95   0   0   0|   0     0 | 479B 2460B|   0  7168M|  12     0 | 0.4  0.3  0.2
  3   4  93   0   0   0|   0     0 | 264B 1066B|   0  7168M|   9     0 | 0.4  0.3  0.2
  3   3  94   0   0   0|   0     0 |2109B 1975B|   0  7168M|  23     0 | 0.4  0.3  0.2
  7   3  90   0   0   0|   0    60k|1798B 5898B|   0  7168M|  25     5 | 0.4  0.3  0.2
  3   3  94   0   0   0|   0    12k| 781B 5625B|   0  7168M|  16     2 | 0.4  0.3  0.2
  2   1  96   0   0   0|8192B   40k| 264B 1082B|   0  7168M|   9     9 | 0.4  0.3  0.2
  2   3  94   0   0   0|   0     0 | 736B 6768B|   0  7168M|  20     0 | 0.3  0.3  0.2
  1   1  98   0   0   0|   0     0 |1977B 1555B|   0  7168M|  19     0 | 0.3  0.3  0.2
 31  50  19   0   0   0|   0    76k|2591B   14k|   0  7168M|  32     9 | 0.3  0.3  0.2
 18  76   0   0   0   6|  12k   56k|1325B 4216B|   0  7168M|  22    12 | 0.5  0.3  0.2
  3   3  94   0   0   0|   0    48k|3103B 6865B|   0  7168M|  32     6 | 0.5  0.3  0.2
 46  46   4   0   0   4|8192B  112k|2439B   10k|   0  7168M|  30    13 | 0.5  0.3  0.2
 30  50  10   0   0  10|   0     0 |2167B 5123B|   0  7168M|  21     0 | 0.6  0.4  0.2
  1   2  97   0   0   0|8192B   28k| 338B  928B|   0  7168M|   8     5 | 0.6  0.4  0.2
  4   6  90   0   0   1|4096B   80k|2431B   10k|   0  7168M|  27     9 | 0.8  0.4  0.2
 43  57   0   0   0   0|   0     0 |2021B 2199B|   0  7168M|  23     0 | 0.8  0.4  0.2
  0   1  98   0   0   0|8192B   48k|1102B 4008B|   0  7168M|  17     6 | 0.8  0.4  0.2
 24  36  39   0   0   0|   0    84k|2105B   10k|   0  7168M|  25     7 | 0.9  0.4  0.2
 18  64   9   0   0   9|4096B    0 |2093B 4985B|   0  7168M|  23     1 | 0.9  0.4  0.2
  0   1  99   0   0   0|8192B   40k| 810B 4430B|   0  7168M|  15     6 | 0.9  0.4  0.2
  2   4  94   0   0   0|   0    60k|2380B   13k|   0  7168M|  31     4 | 0.9  0.4  0.2
  1   5  95   0   0   0|8192B   80k|1715B 3134B|   0  7168M|  22    13 | 1.1  0.5  0.2
----total-cpu-usage---- --dsk/sda-- --net/eth0- -swp/total- -interrupts ---load-avg---
usr sys idl wai hiq siq| read  writ| recv  send| used  free| 2298  2299| 1m   5m  15m 
  7  18  75   0   0   0|   0  8192B|1524B 2909B|   0  7168M|  15     1 | 1.1  0.5  0.2
  1   1  98   0   0   0|   0     0 | 736B 4944B|   0  7168M|  16     0 | 1.1  0.5  0.2
  2   3  94   1   0   0|  12k  116k|2864B   16k|   0  7168M|  41    13 | 1.1  0.5  0.3
 18  55   9   0   0  18|   0  4096B|1890B 1953B|   0  7168M|  17     1 | 1.1  0.5  0.3
 25  75   0   0   0   0|8192B   32k| 453B 3738B|   0  7168M|  11     5 | 1.1  0.5  0.3
  2   4  94   0   0   0|8192B  116k|4675B   13k|   0  7168M|  72    15 | 1.1  0.5  0.3
  9   9  82   0   1   0|   0     0 |5310B   14k|   0  7168M|  62     0 | 1.1  0.5  0.3
  4   3  93   0   0   0|   0  8192B|2114B 2873B|   0  7168M|  32     1 | 1.1  0.5  0.3
 13  10  76   0   0   1|4096B 4096B|8032B   19k|   0  7168M|  91     2 | 1.1  0.5  0.3
at the same time i go to the VM and shell printing lagging

When i use VM with no lagging load AVG = 0.2 to 0.3 with 2 users

Its not the original VM (the original one have a mysql database, not this one)

This kind of VM already use on 5 PVE 1.4, with server base on Core 2 DUO QUAD CORE DDR2, this on on I5 with DD3 and the same hard drive.

Does PVE 1.4 arlready test on DD3 and I5 with P55 ?
 
Few minutes later
with VM not use

Code:
----total-cpu-usage---- --dsk/sda-- --net/eth0- -swp/total- -interrupts ---load-avg---
usr sys idl wai hiq siq| read  writ| recv  send| used  free| 2298  2299| 1m   5m  15m 
  1   3  97   0   0   0|  48k    0 |1953B 2533B|   0  7168M|  23    12 | 1.4  0.8  0.5
  0 100   0   0   0   0|   0     0 | 472B  760B|   0  7168M|   9     0 | 1.4  0.8  0.5
  1   1  97   1   0   0|  48k   92k|2227B 1737B|   0  7168M|  23    30 | 1.3  0.8  0.5
  4   6  87   2   0   0| 228k   12k|1933B 2727B|   0  7168M|  18    23 | 1.3  0.8  0.5
 82  17   1   1   0   0| 876k   20k|1815B 1096B|   0  7168M|  20   119 | 1.9  0.9  0.5
 55   3  40   1   0   0|  12k    0 |2295B 2744B|   0  7168M|  17     2 | 1.9  0.9  0.5
 11  20  67   1   0   0|  53M   64k|1959B 1889B|   0  7168M|  24   691 | 1.9  0.9  0.5
  2  94   1   2   0   1| 117M    0 | 258B  646B|   0  7168M|   7  1485 | 1.9  0.9  0.5
  1   6  64  28   0   0| 114M    0 | 752B  824B|   0  7168M|  12  1004 | 1.9  0.9  0.5
  1  32  51  16   0   0|  20M    0 |1927B 1565B|   0  7168M|  19   379 | 1.8  0.9  0.5
  2   5  30  64   0   0| 216k   40k| 508B  720B|   0  7168M|  11    60 | 1.8  0.9  0.5
  1  17  62  20   0   0| 948k   16k|2369B 2091B|   0  7168M|  28   105 | 1.8  0.9  0.5
  1   4  94   1   0   0|  80k   96k| 828B  786B|   0  7168M|  13    38 | 1.6  0.9  0.5
  5  16  78   0   0   0|4096B   12k|1681B 1571B|   0  7168M|  17     3 | 1.6  0.9  0.5
  1   2  97   0   0   0|  36k   48k|2552B 1717B|   0  7168M|  26    19 | 1.6  0.9  0.5
  0   0 100   0   0   0|   0  8192B| 406B  646B|   0  7168M|   7     1 | 1.6  0.9  0.5
  1   3  90   6   0   0| 112k   48k|2290B 1597B|   0  7168M|  22    37 | 1.5  0.9  0.5
  1   0  99   0   0   0|   0     0 |2001B 1597B|   0  7168M|  19     0 | 1.5  0.9  0.5
  1   2  96   1   0   0|  64k   44k|1330B  706B|   0  7168M|  14    27 | 1.5  0.9  0.5
  1   1  98   0   0   0|8192B   40k| 596B  532B|   0  7168M|   6     8 | 1.5  0.9  0.5
Code:
64 bytes from 192.168.1.111: icmp_seq=940 ttl=64 time=18.7 ms
64 bytes from 192.168.1.111: icmp_seq=941 ttl=64 time=24.6 ms
64 bytes from 192.168.1.111: icmp_seq=942 ttl=64 time=12.9 ms
64 bytes from 192.168.1.111: icmp_seq=943 ttl=64 time=19.3 ms
64 bytes from 192.168.1.111: icmp_seq=944 ttl=64 time=13.9 ms
64 bytes from 192.168.1.111: icmp_seq=945 ttl=64 time=7.58 ms
64 bytes from 192.168.1.111: icmp_seq=946 ttl=64 time=15.2 ms
64 bytes from 192.168.1.111: icmp_seq=947 ttl=64 time=59.3 ms
64 bytes from 192.168.1.111: icmp_seq=948 ttl=64 time=2.52 ms
64 bytes from 192.168.1.111: icmp_seq=949 ttl=64 time=2.29 ms
64 bytes from 192.168.1.111: icmp_seq=950 ttl=64 time=1484 ms
64 bytes from 192.168.1.111: icmp_seq=951 ttl=64 time=29.0 ms
64 bytes from 192.168.1.111: icmp_seq=952 ttl=64 time=41.2 ms
64 bytes from 192.168.1.111: icmp_seq=953 ttl=64 time=14.7 ms
64 bytes from 192.168.1.111: icmp_seq=954 ttl=64 time=37.1 ms
64 bytes from 192.168.1.111: icmp_seq=955 ttl=64 time=22.2 ms
64 bytes from 192.168.1.111: icmp_seq=956 ttl=64 time=47.0 ms
64 bytes from 192.168.1.111: icmp_seq=957 ttl=64 time=3.02 ms
64 bytes from 192.168.1.111: icmp_seq=958 ttl=64 time=4.63 ms
Code:
pveperf -v
CPU BOGOMIPS:      21321.68
REGEX/SECOND:      815234
HD SIZE:           94.49 GB (/dev/pve/root)
BUFFERED READS:    61.00 MB/sec
AVERAGE SEEK TIME: 9.66 ms
rm: option invalide -- /
Pour en savoir davantage, faites: « rm --help ».
open failed at /usr/bin/pveperf line 82.
Code:
pveperf -v
CPU BOGOMIPS:      21321.68
REGEX/SECOND:      818041
HD SIZE:           94.49 GB (/dev/pve/root)
BUFFERED READS:    101.05 MB/sec
AVERAGE SEEK TIME: 13.97 ms
rm: option invalide -- /
Pour en savoir davantage, faites: « rm --help ».
open failed at /usr/bin/pveperf line 82.
Code:
pveperf -v
CPU BOGOMIPS:      21321.68
REGEX/SECOND:      813738
HD SIZE:           94.49 GB (/dev/pve/root)
BUFFERED READS:    74.95 MB/sec
AVERAGE SEEK TIME: 9.71 ms
rm: option invalide -- /
Pour en savoir davantage, faites: « rm --help ».
open failed at /usr/bin/pveperf line 82.
 
Hi,

After changing HDD.
And changing bois HDD type
And try this server with ubuntu(

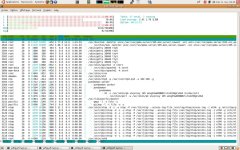
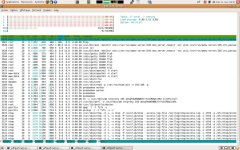
I reinstall PVE 1.4 and i have with htop this result (Attach files)

I think there is a problem, but where ?

I5 problem ?
P55 problem ?

Regards,

Tesquenure
 

Attachments

  • Capture.jpg
    Capture.jpg
    209.8 KB · Views: 9
  • Capture-1.jpg
    Capture-1.jpg
    209.7 KB · Views: 8
Hi,
Tom, Dietmar,

Any sugestion ?

Thx for your help.

we do not have I5 with P55 here in the lab, so we did no test with this hardware.
 
Tom,

For my need, i buy an other serveur.
If i more neer to you i give you this PC for your labs.
But I can give you an SSH acces to this server if you want do some tests on this one.

Regards,
Tesquenure.
 
can you disable the realtek and run just with the e1000 for a while? would be interesting to see if it's the card - I saw similar behaviour LONG ago with ne2k cards that didn't play nice.

(And dedicated slots or not - the ne2k or realteks were junk compared to the 3com / intel cards.)
 
Hi Peril,

Cant find Intel cards here.
But i already try with a 3COM(realtek of in bios).
Same result.

With the realtek, if i dont start a VM i can copy 20 Go of iso and tgz on network, with no problemes.

thx for your suggestion.


Hi Xavster, its a GA-P55m-UD2, why ?


Tesquenure.
 
I just got the P55-UD3

is your onboard nic a realtek ?

I will test to see if it has same issue.
 
Gigabyte GA-P55m-UD2 has an onboard Realtek RTL8111D chip which may be different from the regular RTL8111/8168B chip which is supported by the Proxmox v1.4's backported 8168 driver. Would like to know if it works natively with Proxmox v1.4.

It's latest BIOS is F4 dated 2009/11/06.

I just update bios, after just 40 mn overload CPUs.
 
Hi
I just spent much of the day hunting a similar issue (extreme network latency at times on KVM guests) on a new cluster of 2 x Dell R300's

Turns out that the solution was to turn off CPU Demand based power management in the bios and also (possibly) to rearrange the interrupts so there was the minimum of IRQ sharing between I/O devices

this seems to have totally resolved the issue, before I was seeing ping times for my guests when under no load taking 100's of msec. A clue was that at times it behaved much better when there was some cpu load on a few cores.

Hope this helps
regards
Brendan
 
Hi,

No, i try all last update with no result.

I use it with Ubuntu 9.10 64 server with KVM.

Regards,

Tesquenure.

PS : i dont try yet bminish solution. i try it tonight.
 
Last edited:

About

The Proxmox community has been around for many years and offers help and support for Proxmox VE, Proxmox Backup Server, and Proxmox Mail Gateway.
We think our community is one of the best thanks to people like you!

Get your subscription!

The Proxmox team works very hard to make sure you are running the best software and getting stable updates and security enhancements, as well as quick enterprise support. Tens of thousands of happy customers have a Proxmox subscription. Get yours easily in our online shop.

Buy now!