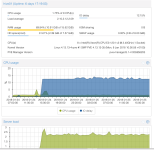
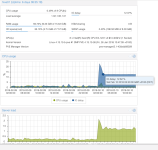
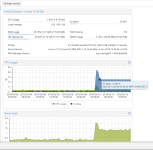
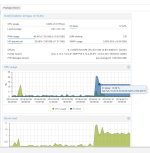
Problem with consistent high io load (~12%) on node in CEPH cluster

Jan 24, 2018
14
0
1
32
Hello,

I seem to be having a problem with one of my nodes in my 3-node Proxmox CEPH cluster. Every x amount of days one of the pve services gets killed by the kernel as hung_task and the node gets stuck in a constant 12% iowait load. It does not recover from this; I have to reboot the node to get it back to normal operation. CEPH cluster status and VM's all seem to be fine with this as it happens, but the load is noticeable on the node itself (slow ssh login, etc). As far as I can tell nothing weird is happening and this occurs quite 'out of the blue'.

I only have KVM VM's running on this node, with HR enabled for some. These use the default CEPH storage created automatically by UI (rdbd). Nodes are based on single Xeon E3-1231v3's with 16GB RAM per node on Supermicro mainboards (pending upgrade to 32GB per node soon). Using Proxmox VE Community 5.1.

I do have NFS storage entries, but these are not enabled and weren't at the time the iowait decided to go up and stick without clear reason. The OS/waldb SSD (a Samsung SM863) is not worn out (0% wear), shows no errors in smartctl and seems to be fine overall.

Did anyone else experience this kind of behaviour, and how would I go about fixing it?

Attached excerpt of syslog (graphs showing it happens from the time it says the task pvesr hung, the previous time this happened it was pve-ha-lrm, so this seems to vary.
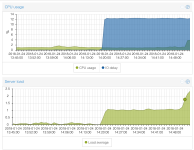
Screen Shot 2018-01-24 at 14.54.37.png

Code:
proxmox-ve: 5.1-35 (running kernel: 4.13.13-4-pve)

pve-manager: 5.1-41 (running version: 5.1-41/0b958203)

pve-kernel-4.13.4-1-pve: 4.13.4-26

pve-kernel-4.13.13-4-pve: 4.13.13-35

libpve-http-server-perl: 2.0-8

lvm2: 2.02.168-pve6

corosync: 2.4.2-pve3

libqb0: 1.0.1-1

pve-cluster: 5.0-19

qemu-server: 5.0-18

pve-firmware: 2.0-3

libpve-common-perl: 5.0-25

libpve-guest-common-perl: 2.0-14

libpve-access-control: 5.0-7

libpve-storage-perl: 5.0-17

pve-libspice-server1: 0.12.8-3

vncterm: 1.5-3

pve-docs: 5.1-15

pve-qemu-kvm: 2.9.1-5

pve-container: 2.0-18

pve-firewall: 3.0-5

pve-ha-manager: 2.0-4

ksm-control-daemon: 1.2-2

glusterfs-client: 3.8.8-1

lxc-pve: 2.1.1-2

lxcfs: 2.0.8-1

criu: 2.11.1-1~bpo90

novnc-pve: 0.6-4

smartmontools: 6.5+svn4324-1

zfsutils-linux: 0.7.3-pve1~bpo9

ceph: 12.2.2-pve1

Thanks in advance.
 

Attachments

  • log-high-iowait.txt
    54.1 KB · Views: 9
Last edited:
Hi,

Is KSM running and how much memory is it be sharing?
How much osd do you have on this node?
Do all osd use the Samsung SM863 as WallDB.
 
Hi,

Is KSM running and how much memory is it be sharing?
How much osd do you have on this node?
Do all osd use the Samsung SM863 as WallDB.
Hi Wolfgang. KSM is not running (or at least, 0 B is shared). All OSD's use the same WAL device (SM863); current OSD's are 2x 3TB HDD's per node. Right now, I still see it is having a constant 12% iodelay overnight (as I haven't reboot it yet since it started). I also noticed pvesr is still causing kernel task_hung messages in dmesg (attached the new messages).

I have never seen this happening on my other 2 nodes by the way. They also run 2 VM's (coparable load, which is almost nothing as this is a test cluster) and iowait is perfectly fine there. Only happens on this node.

Screen Shot 2018-01-25 at 17.57.23.png

Code:
              total        used        free      shared  buff/cache   available
Mem:          15999       11122        4349          94         527        2917
Swap:          8191           0        8191

Thanks for looking into this.
 

Attachments

  • log-iowait-2.txt
    21.1 KB · Views: 7
Last edited:
Some extra info; it seems the process pvesr is really not doing anything anymore (strace attached for at least 15 minutes). It seems pvesr got stuck in io_sch? Also, I cannot kill -9 this process. So it really seems locked up completely.

The special thing about this node was that there was no default gw set. So the attempt to send out a status mail (I suppose?) failed. Could it be that the process hung on this?

Code:
root@hive01:~# strace -p 8583
strace: Process 8583 attached
^C^Z
[1]+  Stopped                 strace -p 8583
root@hive01:~# ps -Al | grep pvesr
0 D     0  8583     1  0  80   0 - 76390 io_sch ?        00:00:00 pvesr
root@hive01:~# ps aux | grep pvesr
root      8583  0.0  0.4 305560 75452 ?        Ds   Jan24   0:00 /usr/bin/perl -T /usr/bin/pvesr run --mail 1
root     23527  0.0  0.0  12760   984 pts/1    S+   21:00   0:00 grep pvesr

Just tried to reboot it; actually also hung the reboot. Had to manually reset the server through IPMI to get it back up and running. Also hung on that same task.
 
Last edited:
I'm not sure but I think you ssd is to slow for so many small writes.
Can you try to move the walldb to a other disk.

The following services on one ssd which all write many small syn writes.
Syslogd
ceph-mon
ceph-osd walldb *2
rrdcached
pmxcfs ->
pve-ha-lrm
pve-ha-crm
pvesr
 
I'm not sure but I think you ssd is to slow for so many small writes.
Can you try to move the walldb to a other disk.

The following services on one ssd which all write many small syn writes.
Syslogd
ceph-mon
ceph-osd walldb *2
rrdcached
pmxcfs ->
pve-ha-lrm
pve-ha-crm
pvesr
Hello Wolfgang,

All nodes have the exact same set-up in hardware and OSD's. How can it be that this one node is experiencing this issue (without the VM's even doing anything), while the others have no problems at all? I mean, if the IO load really was too high for the SSD to handle, with Ceph and 3 copies, the IO load would be equal on every write for all node members, no?

The handful of VM's running right now are idling 95% of the time. The only thing that seems to happen repetitively on one node is that one of the pve services get hung up at a random time - out of the blue - with no load or visible cause, takes 12% of the iowait and then never gives it back (not even when asked to reboot). The SSD itself continues to do its work fine (and Ceph reports no issues).
 
Last edited:
I think the pmxcfs has a io problem.
pvesr try to read the status file what is located in the /etc/pve what is the pxmcfs.
Also you tell other pve services are failing. The most pve services read/write anything in the pmxcfs.
So my suggestion is pmxcfs has a io problem.
You can try the next time to restart pmxcfs.

All nodes have the exact same set-up in hardware and OSD's.
When all the nodes are complete the same, then I would also check for Hardware problems.
Because the software should behave the identically on same HW.
(without the VM's even doing anything),
On which nodes are the VMs?
 
I think that is a valid conclusion. I did notice pmxcfs take most of the I/O. I rebooted the node after adding a default gateway, and made sure the hwclock was synced up correctly. Also, did some tweaking (store logs in ramfs with occasional commits to disk) to minimise I/O load on this one node. It doesn't really seem to help (most writes still being done my pmxcfs), but it gives a bit more peace of mind. It has been fine for 4 days now.

Just noticed my SSD's were on 1% wearout after 3 months of doing virtually nothing. though. It writes an average of 8GB a day (according to the written LBA blocks smartctl tells me) to the SSD without doing much. But I think this is normal. The SSD has a TWDPD of 800GB daily so that should be fine for at least years to come. Still a lot of writing going on with virtually no load at all..

Two VM's on node02, one VM on node01. Before, it was two VM's on node01. But I migrated one over to node01. Node03 is currently only being used for Ceph.

I will let you know if and when it happens again. Thanks for your help so far Wolfgang.
 
Hello. After 7 days of uptime without any trouble, this issue just re-emerged again. I tried as you suggested - trying to restart pmxcfs, but that didn't work as it was locked up solid (couldn't restart service or kill it, not even kill -9, it just didn't want to give in) and had to reboot again to get rid of the 12% constant I/O wait. The only special thing in this case was doing an NFS restore before it happened again. Maybe this is related after all?

I disabled the replication service (as according to kernel_hung_task, this was the process stuck) for now, trying t find out if that helps. Have not tried to restore anything yet since, and it has been up and running for over 5 days again without any trouble.

Will keep you updated.
 
Hello, I'm back sooner than I'd have liked. Last night I planned some backups (on all nodes for all VM's) and today I noticed that ALL nodes have the 12% fixed iowait behaviour. So this is definitely related to backup/restore on NFS storage as I can reproduce this with every single NFS-related activity that I do (earlier I stated I didn't use any backup related activities, but I did mount and use the ISO template storage on same NFS server).

Attached syslogs of all 3 servers from the moment backups commence up until now. In graphs you can clearly see this iowait issue is appearing on all nodes and in the same structured fashion, so it's probably directly related to these backup/restore operations and possibly also NFS storage in combination with ceph backed storage.

So, as @Rob Loan suggested, this might be related after all. But in a different way? As the output of libceph grep on dmesg is still empty.

In the meantime I will fdisable backup and restore through vzdump because this apparently really is broken as it is now.

Code:
root@hive01:~# dmesg | grep libceph
root@hive01:~#

Screen Shot 2018-02-10 at 12.54.36.png Screen Shot 2018-02-10 at 12.54.43.png Screen Shot 2018-02-10 at 12.54.49.png Screen Shot 2018-02-10 at 12.54.56.png

Edit: noticed the syslogs were incomplete. Re-uploaded relevant logs now.

I also noticed some weird messages about pmxcs error'ing on node03.

Code:
Feb  9 17:00:01 hive03 pmxcfs[1667]: [ipcs] crit: connection from bad user 65534! - rejected
Feb  9 17:00:01 hive03 pmxcfs[1667]: [libqb] error: Error in connection setup (1667-24758-27): Unknown error -1 (-1)
Feb  9 17:00:01 hive03 pmxcfs[1667]: [ipcs] crit: connection from bad user 65534! - rejected
Feb  9 17:00:01 hive03 pmxcfs[1667]: [libqb] error: Error in connection setup (1667-24758-27): Unknown error -1 (-1)
Feb  9 17:00:01 hive03 pmxcfs[1667]: [ipcs] crit: connection from bad user 65534! - rejected
Feb  9 17:00:01 hive03 pmxcfs[1667]: [libqb] error: Error in connection setup (1667-24758-27): Unknown error -1 (-1)
Feb  9 17:00:01 hive03 pmxcfs[1667]: [ipcs] crit: connection from bad user 65534! - rejected
Feb  9 17:00:01 hive03 pmxcfs[1667]: [libqb] error: Error in connection setup (1667-24758-27): Unknown error -1 (-1)
Feb  9 17:00:01 hive03 pmxcfs[1667]: [ipcs] crit: connection from bad user 65534! - rejected

What could this be? Only happens on node03 as it seems, might be related (or not, because as that happens there's no noticeable iowait problems as shown by graph).

Edit2: Can't upload node01 log because the forum says its spam. But the other two nodes should give the general idea..
 

Attachments

  • node02.syslog.txt
    58.7 KB · Views: 2
  • node03.syslog.txt
    103.1 KB · Views: 2
Last edited:
Today node01 had the same problem again, without any backup operations running (again). As it's the pve-ha-lrm task hanging all the time, I disabled the HA functionality for now to see if that helps effectively making my cluster useless (but hey - for science!).

The issues as discussed in these topics; https://forum.proxmox.com/threads/problem-mit-dem-pve-ha-lrm-blocked.37589/ and https://forum.proxmox.com/threads/pve-ha-lrm-i-o-wait.38833 seem to be very much alike. However it doesn't seem to be a priority as these issues are already known since november with no cause or fix known?

the issue is known in the sense of "it has been reported", but it is not reproducible so far for us, and thus it is hard to figure out the cause. if you can reliably trigger it (preferably in a test environment), it might get us a lot closer to figuring out why it is occurring.
 
the issue is known in the sense of "it has been reported", but it is not reproducible so far for us, and thus it is hard to figure out the cause. if you can reliably trigger it (preferably in a test environment), it might get us a lot closer to figuring out why it is occurring.
Hi Fabian. Thanks for your reply. I understand that reproducibility is key in solving these issues. Sorry if I offended you or anyone in any way with the way I wrote my reply.

In a bid to investigate I tried to do some testing and with surprising initial results. These were done on the same node, with the same VM.

Testcase 1:
1) Disable HA (remove VM and groups from HA settings in GUI)
2) Run backup of VM to NFS storage
3) Backup finished; all is nominal and node returns to 0% iowait idle
4) No kernel error messages to be found

Testcase 2:
1) Enable HA (add a VM to HA group with multiple nodes)
2) Run backup of HA-protected VM to NFS storage
3) Backup finished; iowait will not go down and is stuck around 12%
4) Messages about hung_task pve-ha-lrm appear in kernel log

I will try to do some more testing but because I only have access to one cluster currently (running semi-production) my hands are tied. Maybe Proxmox can help here?

I also see pve-ha-lrm stuck in D-state, as mentioned in the other topic (in German forums).

Code:
root@hive01:~# ps aux | grep lrm
root      3150  0.0  0.3 325652 65056 ?        Ss   Feb14   0:08 pve-ha-lrm
root      4590  0.0  0.0  12788   896 pts/0    S+   13:38   0:00 grep lrm
root     28118  0.0  0.3 332884 63080 ?        D    13:03   0:00 pve-ha-lrm

Edit: yesterday morning all backups of all VM's were completed successfully and load went back to normal, as expected per above findings. This was without HA resources defined under HA tab in the Datacenter view. I am almost certain that if I run backups again, with HA enabled, the nodes will end up in iowait pve-ha-lrm hung conditions again.
 
Last edited:
which just got an update - looks like a kernel bug, patches are on pve-devel for review and hopefully available in one of the next pve-kernel updates.

updated kernels available on pvetest, see bug for details
 
updated kernels available on pvetest, see bug for details
Almost two months later, there is still no fix for this in stable/pve-enterprise? This bug is still affecting me daily. Right now, 3 of the 4 nodes are in the highio deadlock-state as mentioned in this bug. The only remedy is a reboot of all nodes.

This is also happening when not using HA-manager now (it does this upon trying to run backups). RAM usage on these nodes is high, so that might have something to do with it.

Please fix this as soon as possible. Thanks in advance!

EDIT: I see this post now; https://forum.proxmox.com/threads/c...ve-xyz-process-stuck-for-and-lrm-hangs.43279/. Can I downgrade my pve-enterprise nodes to no-subscription without any issues? I really need a fix for this asap.
 
Last edited:
Can I downgrade my pve-enterprise nodes to no-subscription without any issues?
The upgrade should work without issue, but the package 'corosync-pve_2.4.2-pve5' is already on the enterprise repository.
 

About

The Proxmox community has been around for many years and offers help and support for Proxmox VE, Proxmox Backup Server, and Proxmox Mail Gateway.
We think our community is one of the best thanks to people like you!

Get your subscription!

The Proxmox team works very hard to make sure you are running the best software and getting stable updates and security enhancements, as well as quick enterprise support. Tens of thousands of happy customers have a Proxmox subscription. Get yours easily in our online shop.

Buy now!