PBS backup space grow up constantly

tomasich

New Member
Jul 23, 2025
17
0
1
Hi, can someone help me to understand why the backup space increase contantly day by day?
I have two storage spaces for two different backup jobs, located to a NAS, PBS is a VM on my PVE cluster.
Every day for each vm I have 1 hour backup from 7am to 6 pm and at 9pm another backup.
After last backup I have prune to keep only last backup of the day and after that a GC to clear.
But the space increase day by day, the vm are the same, non tasks modification.
1779904448443.png
 
Hi,

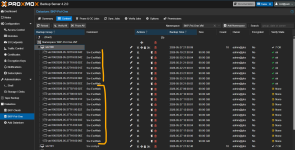
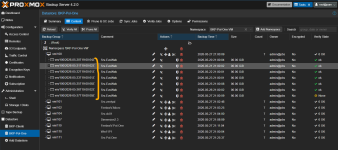
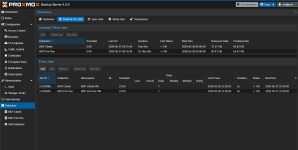
Between your 2nd and 3rd posts, there is a huge difference. You should look at the prune log back in time to find out why the pruning was not happening, because your screen on the 2nd post is not "well done" like you thought (because you have 11 backups instead of 1).

Best regards,
 
  • Like
Reactions: Johannes S
Hi,

Between your 2nd and 3rd posts, there is a huge difference. You should look at the prune log back in time to find out why the pruning was not happening, because your screen on the 2nd post is not "well done" like you thought (because you have 11 backups instead of 1).

Best regards,
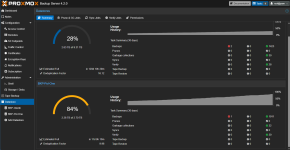
You have to look at 4th...
 
Hi,

Now you need to run the GC and wait 24h5min or 1445min (default setting).

Prunning doesn't free the space immediately, it's only the GC that can free the space.

And have you check your backup log to see the size of data backup ?

Best regards,
 
  • Like
Reactions: Johannes S
Hi,

Now you need to run the GC and wait 24h5min or 1445min (default setting).

Prunning doesn't free the space immediately, it's only the GC that can free the space.

And have you check your backup log to see the size of data backup ?

Best regards,
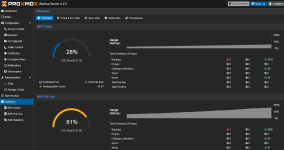
As I wrote, I run GC avery night... but the curve grow up as you can see, why?
Can I provide you some logs to understand?
Vm are the same, just one has a small database but modification by day are very small, many other vm has no data incremets or better, only os maintenace like updates and so on.
But on my side it's quite stange this constant growth
 
Hi,

You should really check the backup log to have the exact data size.

For VMs with small data changes (as you said), 50 to 70GB a day seems a lot to me, or you just don't know that your VMs really have a high data change, and therefore your deduplication factor should be pretty low.

And for last, only the log can help; the screen of the WebUI is pretty much useless.

Best regards,
 
Hi,

You should really check the backup log to have the exact data size.

For VMs with small data changes (as you said), 50 to 70GB a day seems a lot to me, or you just don't know that your VMs really have a high data change, and therefore your deduplication factor should be pretty low.

And for last, only the log can help; the screen of the WebUI is pretty much useless.

Best regards,
Can I send you logs for a backup cycle?
I can't really understand why this constant growth...
 
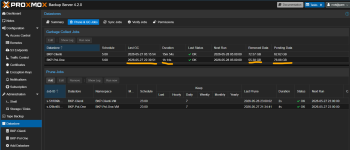
In your first screenshot there is "Prunes 0". Is this still the case?

You may trigger pruning manually via "Run now" - and watch the log live.

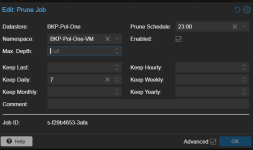
Are namespaces involved? The "Edit: Prune Job" has a "Max. Depth" setting. If this is set to low it may ignore sub-namespaces.
 
  • Like
Reactions: Johannes S
increasing space usage like this can also be caused by VMs not freeing up unused space properly (i.e., not discarding it). VM backups happen on the block layer - the full VM virtual disk is backed up. if applications inside the VM do a lot of temporary writes, they might dirty a lot of the disk even though within the VM it looks like most space is unused. I'd check the backup task logs to see if there are VMs that have an unexpectedly high rate of change. of course it could also just be natural growth over time - e.g., log files/state/.. accumulating inside the guests.
 
  • Like
Reactions: Johannes S
In your first screenshot there is "Prunes 0". Is this still the case?

You may trigger pruning manually via "Run now" - and watch the log live.

Are namespaces involved? The "Edit: Prune Job" has a "Max. Depth" setting. If this is set to low it may ignore sub-namespaces.
Hi, if you read the posts... I've done it.

"Are namespaces involved? The "Edit: Prune Job" has a "Max. Depth" setting. If this is set to low it may ignore sub-namespaces."
I'm not sure to understand well.
This is my config, it seems not set.

1779954987880.png
 
This is my config, it seems not set.
Correct. That default is fine!

But you have configured an explicit NS "BKP-Pol-One-VM". Dig at this fact, it may be the reason for the confusion...

You could remove that explicit Namespace here and Prune the whole Datastore "BKP-Pol-One"!
 
Last edited:
Increasing VM sizes like Fabian said seems plausible.

But it doesn't explain the prunes not being registered in the Task Summary. Might be some permission/namespace mismatch? Although your prune logs don't show any error and the garbage collects are being registered.

Then again, disk filling up is actually more of a garbage collect issue than a prune thing. Did you already look into those?
 
Last edited:
  • Like
Reactions: Johannes S
Correct. That default is fine!

But you have configured an explicit NS "BKP-Pol-One-VM". Dig at this fact, it may be the reason for the confusion...

You could remove that explicit Namespace here and Prune the whole Datastore "BKP-Pol-One"!
I don't understand, Namespace are created to organize backups, what is wrong?
 
I don't understand, Namespace are created to organize backups, what is wrong?
Nothing.

But we are debugging the "Prune 0" shown on the dashboard. It does not feel right, correct? Perhaps it is a "display"-error in the sense that it shows the number of prunes for the Datastore but not if there is only pruning only of a (sub-) namespace.

I am just guessing, I did not test/verify that...