Opt-in Linux 7.0 Kernel for Proxmox VE 9 available

Is there a way to « Escalate « this to Kernel maintainers ?
This would probably have to be reported to the Ubuntu kernel people? I have tried skimming over the changes between Ubuntu-7.0.0-28.28 and Ubuntu-7.0.0-28.28i2, but there was nothing obvious to me.
The problem was still present in 7.0.14-9 - just now rebooted my test machine into 7.0.14-11, but it usually takes a few hours or a day to run into a sample...
 
No change with 7.0.14-12-pve, but I assume no one (except Munin users) is feeding on /sys/block/ data as statistics source nowadays, since I haven't seen the problem mentioned elsewhere ‍*shrug*
 
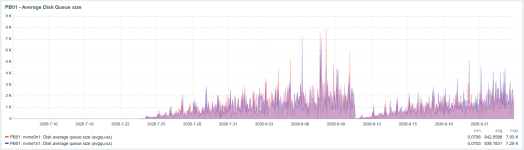
Zabbix is also reporting high disk queue size since kernel 7 update.
I haven't noticed performance impact on those hosts, tho. Just cosmetics?

Item definition:
NameDescriptionTypeKey and additional info
{#DEVNAME}: Disk average queue size (avgqu-sz)The current average disk queue; the number of requests outstanding on the disk while the performance data is being collected.Dependent itemvfs.dev.queue_size[{#DEVNAME}]
Preprocessing

  • JSON Path: $[10]
  • Change per second
  • Custom multiplier: 0.001
{#DEVNAME}: Get statsThe contents of get /sys/block/{#DEVNAME}/stat to get the disk statistics.Zabbix agentvfs.file.contents[/sys/block/{#DEVNAME}/stat]
Preprocessing

  • JavaScript: return JSON.stringify(value.trim().split(/ +/));


PB01: Ryzen 7 5700X + TUF GAMING X570 + 2x 1TB NVMe SSD ZFS MIRROR (Force MP600)
1787599175606.png
Bash:
journalctl -g 'Linux version' --no-pager -S '2 months ago'
Jul 10 07:01:31 pb01 kernel: Linux version 6.17.13-15-pve (build@proxmox) (gcc (Debian 14.2.0-19) 14.2.0, GNU ld (GNU Binutils for Debian) 2.44) #1 SMP PREEMPT_DYNAMIC PMX 6.17.13-15 (2026-07-07T09:34Z) ()
Jul 15 07:00:43 pb01 kernel: Linux version 6.17.13-16-pve (build@proxmox) (gcc (Debian 14.2.0-19) 14.2.0, GNU ld (GNU Binutils for Debian) 2.44) #1 SMP PREEMPT_DYNAMIC PMX 6.17.13-16 (2026-07-09T10:34Z) ()
Jul 21 07:00:51 pb01 kernel: Linux version 6.17.13-18-pve (build@proxmox) (gcc (Debian 14.2.0-19) 14.2.0, GNU ld (GNU Binutils for Debian) 2.44) #1 SMP PREEMPT_DYNAMIC PMX 6.17.13-18 (2026-07-15T10:30Z) ()
Jul 24 07:00:41 pb01 kernel: Linux version 7.0.14-6-pve (build@proxmox) (gcc (Debian 14.2.0-19) 14.2.0, GNU ld (GNU Binutils for Debian) 2.44) #1 SMP PREEMPT_DYNAMIC PMX 7.0.14-6 (2026-07-20T14:45Z) ()
Aug 11 07:30:50 pb01 kernel: Linux version 7.0.14-11-pve (build@proxmox) (gcc (Debian 14.2.0-19) 14.2.0, GNU ld (GNU Binutils for Debian) 2.44) #1 SMP PREEMPT_DYNAMIC PMX 7.0.14-11 (2026-08-06T23:36Z) ()

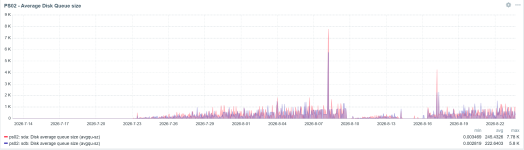
PS02: i5-13400 + TUF B760M-PLUS + 2x 1,92TB SATA SSD ZFS MIRROR (Enterprise MK001920GWCFB, VK001920GWTTC)
1787599372207.png
Bash:
journalctl -g 'Linux version' --no-pager -S '2 months ago'
Jul 09 13:15:54 ps02 kernel: Linux version 6.17.13-15-pve (build@proxmox) (gcc (Debian 14.2.0-19) 14.2.0, GNU ld (GNU Binutils for Debian) 2.44) #1 SMP PREEMPT_DYNAMIC PMX 6.17.13-15 (2026-07-07T09:34Z) ()
Jul 15 07:00:48 ps02 kernel: Linux version 6.17.13-16-pve (build@proxmox) (gcc (Debian 14.2.0-19) 14.2.0, GNU ld (GNU Binutils for Debian) 2.44) #1 SMP PREEMPT_DYNAMIC PMX 6.17.13-16 (2026-07-09T10:34Z) ()
Jul 21 07:00:47 ps02 kernel: Linux version 6.17.13-18-pve (build@proxmox) (gcc (Debian 14.2.0-19) 14.2.0, GNU ld (GNU Binutils for Debian) 2.44) #1 SMP PREEMPT_DYNAMIC PMX 6.17.13-18 (2026-07-15T10:30Z) ()
Jul 23 07:46:42 ps02 kernel: Linux version 7.0.14-6-pve (build@proxmox) (gcc (Debian 14.2.0-19) 14.2.0, GNU ld (GNU Binutils for Debian) 2.44) #1 SMP PREEMPT_DYNAMIC PMX 7.0.14-6 (2026-07-20T14:45Z) ()
Aug 10 13:10:55 ps02 kernel: Linux version 7.0.14-11-pve (build@proxmox) (gcc (Debian 14.2.0-19) 14.2.0, GNU ld (GNU Binutils for Debian) 2.44) #1 SMP PREEMPT_DYNAMIC PMX 7.0.14-11 (2026-08-06T23:36Z) ()

By sampling values, we can see high spikes:
Bash:
ps02: sda: Disk average queue size (avgqu-sz)
2026-08-24 16:44:26  0.01052
[...]
2026-08-24 15:55:26  0.00915
2026-08-24 15:54:26  0.01025
2026-08-24 15:53:26  20321.5902 <--
2026-08-24 15:52:26  0.0119
2026-08-24 15:51:26  0.0117
2026-08-24 15:50:26  0.009467
2026-08-24 15:49:26  0.00955
2026-08-24 15:48:26  0.009083
2026-08-24 15:47:26  0.009983
2026-08-24 15:46:26  0.01002
2026-08-24 15:45:26  20314.5085 <--
2026-08-24 15:44:26  0.01073
2026-08-24 15:43:26  0.0089
2026-08-24 15:42:26  0.009733
2026-08-24 15:41:26  0.01107
2026-08-24 15:40:26  0.009867
[...]
2026-08-24 15:14:26  0.008983
2026-08-24 15:13:26  0.009083
2026-08-24 15:12:26  0.01102
2026-08-24 15:11:26  0.01025
2026-08-24 15:10:26  20278.7035 <--
2026-08-24 15:09:26  0.008883
2026-08-24 15:08:26  0.01043
[...]
2026-08-24 14:34:26  0.008383
2026-08-24 14:33:26  0.008883
2026-08-24 14:32:26  20241.3041 <--
2026-08-24 14:31:26  0.01068
2026-08-24 14:30:26  0.009917
2026-08-24 14:29:26  40476.3976 <--
2026-08-24 14:28:26  0.01168
2026-08-24 14:27:26  0.00905
2026-08-24 14:26:26  0.01522
 
Kernel 7.0.0-2-pve will freeze the host if total free RAM becomes low (< 5 to 10% free). Any one seeing this issue? I just have to back off the RAM requirements for my VMs a little (now around 87% usage) and everything works again.

Host do not freeze when on `6.17.13-4-pve` though.

FYI. Been meaning to tidy up this host anyway o_O, but now problem solved. :D

---
AMD Ryzen 5 5600G, 64 GB RAM
I'm experiencing exactly the same issue.
With 32 GB of RAM, I have to leave 8 to 10% free, or the Proxmox host freezes and the fans go wild. I first noticed this after rebooting following the update to kernel 7.0: the fans went wild, and I couldn’t connect to the Proxmox host. I reverted to 6.17, disabled a VM from auto-starting, rebooted to 7.0 and it booted fine. I then manually started the VM after the Proxmox host had fully booted, and it froze with the fans running wild. After tweaking other settings, I ended up reducing the RAM allocated to this VM, and it worked.

This has been happening since the first release, I'm now on kernel 7.0.14-11.
I just updated to kernel 7.0.14-14 and will check if the behavior persists.

Is it mandatory with kernel 7.0 to leave more RAM free? With the previous 6.17.13-21, I could allocate more RAM to my VMs without issues.
 
Last edited:
Hello,

I have 2 servers running proxmox, both mini-pc with 2 ssd inside.
One machine is running on zfs, the other on ext4 on top of raid1 (mdadm)
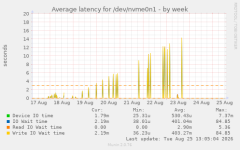
Since kernel 7.0.14-6, i also have huge latency spikes, by several seconds. on both machines.
And i also use munin :) which allowed me to be aware of the issue. and see that the issue was getting worse after some time.

here is an example of munin graph showing the latency spikes on 1 drive
1787656012588.png

Thanks to you, i know undestand that my hardware and drive are not failing.
I reinstalled kernel 7.0.14-5 and pinned it with proxmox-boot-tool.
Then i rebooted my 2 servers.
They've been running this kernel for 2 days, and no more latency spikes :)

I also can see there is a new kernel, 7.0.14-14. does anyone know if this latency issue also happens with this kernel ?

Thanks

edit: for the diskstats munin plugin, once you've clicked on it, the graphs are shown with a logarithmic y axis.
not really easy to read..
to make it easier, you can edit /etc/munin/plugins/diskstats
around line ~877, search the ones saying

graph_title Average latency for /dev/$pretty_device
graph_args --base 1000 --logarithmic

then replace --logarithmic by -l 0
and restart munin-node.
next time, the graphs will be showed with us/ms y axis ;)
 
Last edited:
I've provided Claude a sample of /sys/block/sda/stat and asked for it to identify the pattern in the spikes.
It makes sense to me, and it does increase as the uptime also increases.
Every spike equals the machine's uptime. Not correlated with it — equal to it, to within 0.3%. At 08:55 (20 min after boot) the counter jumped 1,223,591 ms; at 13:30 (295 min after boot) it jumped 17,704,148 ms. Two of the 27 jumped exactly twice uptime, meaning two events landed in the same 60-second sample.

Some supporting details:
  • time_in_queue jumps by the identical amount in the same interval, to within a few ms. Both are per-request accumulators fed by the same subtraction.
  • io_ticks stays completely normal (~230 ms, never above 9,937 in any interval — well under the 60,000 ms ceiling a 60s window allows). That's the proof it's not real: io_ticks measures wall-clock device-busy time and physically can't lie, and it says the disk was ~0.4% busy while write ticks claims days of latency.
  • The actual I/O in spike intervals is unremarkable — ~5,100 write I/Os and ~160,000 sectors, statistically identical to quiet intervals.
The mechanism is a request whose start timestamp was zero (or boot-relative) when completion time was subtracted from it, so the "latency" recorded is the current jiffies value — i.e. uptime. Classic on virtio/NVMe under a hypervisor, or with a driver mishandling a requeued/timed-out request.

Two other things in the file worth knowing:

There's a reboot at 08:35:36. Counters reset to near-zero, and the sample gap is 120s there instead of 60s. Any naive diff across that boundary produces a −2.09 billion garbage value.

The pre-reboot data has the same bug. At 08:29:36, write ticks jumped 662,925,014 ms = 7.67 days, with time_in_queue up 662,925,035. Same signature — that was the previous boot's uptime.

The real writes. Once you drop the 27 corrupted intervals, the remaining 279 are clean and boring: median 490 ms per minute, max 3,926 ms, and 0.83 correlation with sectors written. Average per-write latency works out to 0.11 ms, consistent with SSD/NVMe. The genuine variation is just larger flush batches — the top clean intervals (08:37, 13:28, 13:34) all show ~500,000 sectors versus the typical ~160,000.

So: filter intervals where Δwrite ticks ≈ n × uptime_ms, split at the reboot, and use io_ticks as your sanity check going forward. Any latency conclusion drawn from the raw write ticks deltas is measuring a driver bug, not your storage.

 

Attachments