Opt-in Linux 7.0 Kernel for Proxmox VE 9 available

Data point: ixgbe (Intel X550) tx-hang regression in 7.0.0-3-pve — resolved in 7.0.14-5-pve

Sharing in case anyone else on an early opt-in 7.0 build hits mystery packet loss.

Hardware: AMD EPYC host, Intel X550 dual-port 10GbE (ixgbe), copper link negotiated at 2.5G NBASE-T to a UniFi switch. PVE 9, no PCIe passthrough on the NIC, standard vlan-aware vmbr bridge.

Symptoms on 7.0.0-3-pve — starting ~76 seconds after boot and repeating every 10-15 seconds indefinitely (~3,400 events/day):

ixgbe 0000:42:00.0 nic1: NETDEV WATCHDOG: CPU: 5: transmit queue 21 timed out 5229 ms
ixgbe 0000:42:00.0 nic1: initiating reset due to tx timeout
ixgbe 0000:42:00.0 nic1: Reset adapter
ixgbe 0000:42:00.0 nic1: NIC Link is Up 2.5 Gbps, Flow Control: RX/TX

The interesting failure mode is per-flow packet loss: flows RSS-hashed onto the hung tx queue blackhole completely (100% loss) while flows on other queues are unaffected (0%), and each adapter reset reshuffles which destinations are affected. From the outside it looks like a flaky ISP or a bad cable rather than a NIC problem — ping one IP and get 100% loss, ping another at the same moment and get 0%. It was always queue 21 in our case. Forcing the link down to 1G did NOT stop the hangs, so it does not appear to be NBASE-T signal-integrity related. No IOMMU page faults logged (mentioning because there is a separate thread about ixgbe reset loops following AMD-Vi IO_PAGE_FAULT — ours starts clean from boot, so it is a different trigger).

Kernel comparison, same hardware/cabling/config:
- 6.17.13-2-pve: 17 days uptime, zero resets
- 7.0.0-3-pve: resets from 76 seconds after boot, ~3,400/day
- 7.0.14-5-pve: zero resets, several hours of soak at 2.5G with the default 63 queues

Whatever the regression was, it appears fixed in 7.0.14-5-pve — if you are on an early 7.0 opt-in build with an ixgbe NIC, just update. Posting mainly so this is searchable for the next person staring at "transmit queue N timed out" and blaming their switch.
 
Has anyone seen problems with I/O latencies on SSD/NVMEs when using the 7.0.14-6-pve kernel (from pve-no-subscription repos)?

I had to downgrade both of my homelab hosts to 7.0.14-4-pve after running into lockups with I/O wait times in the 10s of seconds after upgrading. Haven't seen any warnings in my monitoring since. (I'm using a simple setup with LVM-thin on mdraid on both machines.)

Don't know about 7.0.14-5, never installed that.
 
This actually maybe the area of concern, as I remember reading on these forums of users having issues with the latest kernels when using mdadm, which as you can see here, PVE does not support.
I'm well aware of the limitations of mdraid, but at the same time it's in wide enough use that it would be pretty bad if something was broken with that in particular.

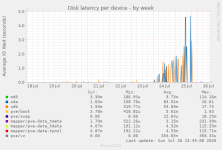
It's also possible that nothing is wrong in reality, and the statistics sources provided by the kernel are off for some reason - in particular I'm using data from /sys/block/<dev>/stat as parsed by the Munin diskstats module.

In general, I'm asking for observations, not help. If it turns out no one else sees something similar when going past 7.0.14-4-pve, I'll probably have to do something about my setup ‍;)

[edit] Latency peaks in this graph exactly match the time while I was running 7.0.14-6-pve. One strangeness in the values shown is that only the statistics for the underlying block devices seem to be affected (sda/sdb), but not the upper layer md and lvm devices, which should inherit I/O waits from the physical storage layer...?
diskstats_latency-week.png
 
Last edited:
Has anyone seen problems with I/O latencies on SSD/NVMEs when using the 7.0.14-6-pve kernel (from pve-no-subscription repos)?

I experienced it on a 5 node cluster.
Each node used the same hardware with 3 NVME split into 3 partitions:
  • / is md raid 5
  • /vaz/lib/vz is a lvm raid 5, storage used only for backup and template
  • ceph osd, main storage
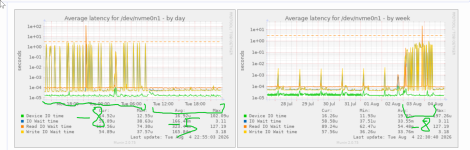
Proxmox metrics and VM performance do not seems affected but munin start to show latency peeks

Capture d'écran_20260727_100957-1.png
 
  • Like
Reactions: Galaxis
Proxmox metrics and VM performance do not seems affected but munin start to show latency peeks
Ah, so we're more likely looking for some weirdness between block device statistics and diskstats calculations then... Wonder what changed there...
 
Last edited:
@Galaxis you're not crazy ;

https://forum.proxmox.com/threads/i...nce-9-2-6-and-associated-7-0-x-kernel.185498/
That is my own topic I created.

It's basically unusable (I've got 440 emil alerts this morning) and very concerning as this showed up on a variety of proxmox hosts when I upgraded them.
I'll rollback this latest kernel. I also wasn't aware that such regressions could happen in a routine upgrade.

Screenshot_dCj0xpftWM.png
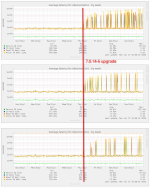
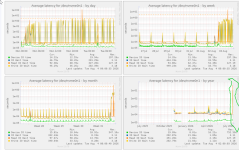
As the yearly graph clearly shows ; This absolutely never happened with any kernel before (6.x.x and 7.0.x) and seems specific to 7.0.14-8 (not there in -5). The spikes in january are real mdam rebuilds ( order of magnitude faster than today's problem)

As far as wether or not this is "a real problem" (affecting performance) and not some statistics weirdness ; in my case it's difficult to tell because they all run at like 10% capacity ; however 8 of my 20 servers are webservers, I'll add extra external monitoring today and report.

But it is also very visible in iostat and iotop, so it's not "only a munin problem" ; it's at the very least a problem with all ways of reporting IO waits, which is a problem enough for me;

Also the spikes are in the SECONDS, there is no way the number makes sense ; nothing should make an SSD wait seconds ; so the problem is real in the sense that the numbers are either very wrong and need fixing, or the drives are actually waiting 3 sec, which is even worse. I confirm like Galaxy that the spikes do not appear in MD "meta" devices, only on physical & loop drives (of the host) and all drives on the guest VMs and guest LXCs.

Finally, munin is by default configured to report spikes of 3 seconds and above by email, even for loop devices (which you get a lot in PVE situations) so anyone closely monitoring their system will soon get flooded (800 emails per day) and come here after upgrade.
 
Last edited:
  • Like
Reactions: Johannes S
could you also check the kernels inbetween? in particular -6 would be interesting, as that is the first of two stable updates in that version range (the second was -7)
 
  • Like
Reactions: Johannes S
could you also check the kernels inbetween? in particular -6 would be interesting, as that is the first of two stable updates in that version range (the second was -7)
Since @weppa writes it was still fine in -5 (which I skipped coming from -4), and the effect first showed up for me in -6, something must have happened between those two versions.
 
  • Like
Reactions: weppa
I'm back at -5 and the problem vanished .

Screenshot_mmIFmfNEnG.png

So basically the problem appeared in -6 (as per Galaxis) , is still there in -8, I was just a bit late in the game.

If it's a new kernel feature and not the sign of the disks getting crazy, it sure must be discussed with iotop, and anyone monitoring disk latency.

Given the importance of the servers in my setup I had to stay cautious, I cannot confirm if the performance issues are real, I'll try on a less critical server.
 
If this ever gets to a kernel developer : this is super easy to replicate ; just add munin package on a vm or LXC, or even on the host itself.
monitoring disk latency is default.

pve devs say for -6

update submodules and patches to Ubuntu-7.0.0-28.28i2
- upstream stable changes from 6.18.38 and 7.1.3
- fix CVE-2026-53361
- fix CVE-2026-53362

Interestingly there are a lot of NVME related changes in timeouts and queue handling.
 
Last edited:
this is most likely sadly not a regression of latency but a fix for actually showing latency stats correctly and not underreporting them, as that kernel got 9c69b6190efc block: invalidate cached plug timestamp after task switch which fixes a commit introduced in v6.9. You could confirm by booting a 6.8 kerne if you still got one around, or do a fio benchmark before and after and see if throughput actually changes to confirm this for real.
 
This creates spikes that are well above munin defaults for sending emails. And these defaults are set by munin maintainers ?
It's 0:3 by default (warning/email if above 3 seconds). It's like that since 20 years I believe...

WARNINGs: Write IO Wait time is 6.83 (outside range [0:3]).
What's bizarre here is the "latency" reported since 7.0.14-5 is really obscene ( > 6 seconds here) and unlikely for a 5GHZ EPYC 24 cores running a raid array of entreprise SSDs.
In this context, 60ms (millisecond) latency is 3 times slower than a slow spinning HD drive. For an NVME it's ridiculous (should be microseconds)
So let's not even talk about seconds...

Also it doesn't affect metadevices. So the stats say that the underlying physical disks are lagging, but the MD created out of them does not (?)

To me, it's clearly a bug. Stats may be under estimated since 6.9 but now I think they are vastly over estimated in some way in some scenarios.
This is really a problem for experts , I'm not one of them, just trying to describe what we see the best I can.
 
Last edited:
This creates spikes that are well above munin defaults for sending emails. And these defaults are set by munin maintainers ?
It's 0:3 by default (warning/email if above 3 seconds). It's like that since 20 years I believe...

WARNINGs: Write IO Wait time is 6.83 (outside range [0:3]).
What's bizarre here is the "latency" reported since 7.0.14-5 is really obscene ( > 6 seconds here) and unlikely for a 5GHZ EPYC 24 cores running a raid array of entreprise SSDs.
In this context, 60ms (millisecond) latency is 3 times slower than a slow spinning HD drive. For an NVME it's ridiculous (should be microseconds)
So let's not even talk about seconds...

Also it doesn't affect metadevices. So the stats say that the underlying physical disks are lagging, but the MD created out of them does not (?)

To me, it's clearly a bug. Stats may be under estimated since 6.9 but now I think they are vastly over estimated in some way in some scenarios.
This is really a problem for experts , I'm not one of them, just trying to describe what we see the best I can.
I'm not familiar with this monitoring tool, but I'm curious if there's any traffic over on their github/where ever their bugs are tracked about this.

If this is related to a kernel bugfix ( https://forum.proxmox.com/threads/o...for-proxmox-ve-9-available.182328/post-864444 ) in the Ubuntu kernel, it should be hitting a lot of other users outside Proxmox's userbase, right?
 
  • Like
Reactions: Johannes S
I'm not familiar with this monitoring tool, but I'm curious if there's any traffic over on their github/where ever their bugs are tracked about this.
Munin is a basic monitoring tool that mostly consists of a daemon running plugins (scripts) that produce output in Munin format, and a data collector that polls for this information, usually every five minutes. The collector writes everything into rrd files.
It's super easy to get a basic system monitoring up and running thanks to a plethora of existing scripts, and a new Munin plugin can be written in a couple lines of bash with some specific boilerplate.
All of this is partially ancient, but still kinda sorta maintained. The affected diskstats plugin in particular is a Perl script and makes some assumptions about behaviour and contents of the block device statistics files. It's not impossible one of those doesn't hold up anymore - for example there's heuristics for integer wraparounds, and the results somewhat look like something might be wrong in that direction, but that's just a hunch.

Anyways, I'm currently recording raw output of /sys/block/<dev>/stat on two machines with both unaffected and newer kernels, so I can maybe have a look at that tomorrow, and find out if there's something out of the ordinary with this source data that could explain what we're seeing.
 
Last edited:
Ok, so: There's definitively something odd with the block layer statistics for phyiscal devices in these kernel versions (7.0.14-8 now).

In my log, I see sudden large jumps in write ticks and time_in_queue values, like in this example (leading time stamp is from my script, it's column 8 and 11 of the actual data):

Code:
2026-08-06T12:07:22+02:00    57105     7308  4439873  3136422   864728    83793 20820759 20820768        0  1069214 24834111      671      376   480512    23646   250760   853273
2026-08-06T12:08:22+02:00    57108     7308  4440257  3136430   865272    83879 20832238 20822223        0  1070440 24836592      671      376   480512    23646   251019   854291
2026-08-06T12:09:22+02:00    57108     7308  4440257  3136430   866138    83978 20852765 20824006        0  1071779 24839455      671      376   480512    23646   251335   855371
2026-08-06T12:10:22+02:00    57108     7308  4440257  3136430   867080    84071 20864908 71673470        0  1072894 75689812      671      376   480512    23646   251648   856263
2026-08-06T12:11:22+02:00    57108     7308  4440257  3136430   867691    84142 20872976 71675005        0  1074077 75692290      671      376   480512    23646   251929   857207
2026-08-06T12:12:22+02:00    57108     7308  4440257  3136430   868571    84240 20886906 71676830        0  1075279 75695103      671      376   480512    23646   252194   858195

Between two minutely measurements, write ticks suddenly jumps from 20824006 to 71673470 and time_in_queue from 24839455 to 75689812, while otherwise incrementing in a more sane pace. This is also when the Munin stats show useless values. Can't see anything similar happening in data from the old kernel.

At the same time, the measurements for an md device that uses this disk are completely normal even with a new kernel.
 
  • Like
Reactions: weppa
proxmox-kernel-signed-7.0 (7.0.14+9) is available and numerous CVEs are mentioned in the changelog, but not CVE-2026-64564 "SCTPhantom" - is this kernel still vulnerable?
 
proxmox-kernel-signed-7.0 (7.0.14+9) is available and numerous CVEs are mentioned in the changelog, but not CVE-2026-64564 "SCTPhantom" - is this kernel still vulnerable?
CVE-2026-64564 should be fixed with 7.0.14-10 - 7.0.14-11 (additionally containing a fix for CVE-2026-68480) is already available on pve-test

I hope this helps!
 
  • Like
Reactions: harrydus