Hello,
I am referring to this thread: https://forum.proxmox.com/threads/postscreen-statistics-are-no-longer-displayed.85995/
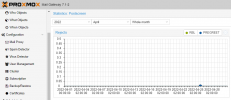
I am having the same issue. As soon as I enabled DNSBL sites under "Mail Proxy" => "Options", no statistic regarding postscreen is generated anymore. Also, there is no specific statistic for DNSBL in PMG.
Yes
The 'pmgpolicy' daemon is enabled and running.
Any hints?
I am referring to this thread: https://forum.proxmox.com/threads/postscreen-statistics-are-no-longer-displayed.85995/
I am having the same issue. As soon as I enabled DNSBL sites under "Mail Proxy" => "Options", no statistic regarding postscreen is generated anymore. Also, there is no specific statistic for DNSBL in PMG.
Code:
Mar 27 17:05:56 pmg postfix/2525/postscreen[12000]: CONNECT from [212.192.246.179]:59126 to [<censored>]:25
Mar 27 17:05:56 pmg postfix/dnsblog[12014]: addr 212.192.246.179 listed by domain dnsbl-2.uceprotect.net as 127.0.0.2
Mar 27 17:05:56 pmg postfix/dnsblog[12003]: addr 212.192.246.179 listed by domain spam.spamrats.com as 127.0.0.38
Mar 27 17:05:56 pmg postfix/dnsblog[12023]: addr 212.192.246.179 listed by domain dnsbl-3.uceprotect.net as 127.0.0.2
Mar 27 17:05:56 pmg postfix/dnsblog[12009]: addr 212.192.246.179 listed by domain zen.spamhaus.org as 127.0.0.4
Mar 27 17:05:56 pmg postfix/2525/postscreen[12000]: PREGREET 11 after 0.04 from [212.192.246.179]:59126: EHLO User\r\n
Mar 27 17:05:56 pmg postfix/2525/postscreen[12000]: DNSBL rank 6 for [212.192.246.179]:59126
Mar 27 17:05:56 pmg postfix/2525/postscreen[12000]: DISCONNECT [212.192.246.179]:59126
Yes
journalctl -o json --output-fields '__CURSOR,MESSAGE' --no-pager --identifier 'postfix/postscreen' -n 5000 gives output, but only until I enabled DNSBLs!The 'pmgpolicy' daemon is enabled and running.
Any hints?
Last edited:


")