Hello,
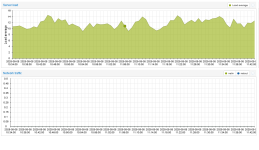
I faced a bit strange behavior for proxmox UI dashboard, related to graph "Network traffic". The graph just empty. Screenshot attached:

pve version 8.2.0
I'm thinking that it might be because of our network setup. Here is what we have across all hosts:
interface names are pinned to MAC via udev.
The question is if there is a way to make dashboard workable with our network config?
I've tried to remove/reset rrd database like rm /var/lib/rrdcached/db/pve2-node/<node_name>. Tried to manipulate DS in the rrd DB. But nothing was working.
One step of thinking to populate metrics manually via cron like rrdtool update "$RRD_FILE" N:$update_str, but it is too much . So, maybe someone knows a better way for this network config?
I faced a bit strange behavior for proxmox UI dashboard, related to graph "Network traffic". The graph just empty. Screenshot attached:

pve version 8.2.0
I'm thinking that it might be because of our network setup. Here is what we have across all hosts:
Code:
$cat /etc/network/interface

auto lo
iface lo inet loopback

iface ext_eth0 inet manual
iface ext_eth1 inet manual

iface int_eth0 inet manual
iface int_eth1 inet manual

auto bond0
iface bond0 inet manual
    bond-slaves int_eth0 int_eth1
    bond-mimon 100
    bond-mode 802.3ad
    bond-xmit-hash-policy layer3+4

iface bond0.2001 inet manual

auto vmbr0
iface vmbr0 inet static
    bridge-ports bond0.2001
    bridge-stp off
    bridge-fd 0
    address 10.0.10.2/16
    gateway 10.0.0.1

iface bond0.2004 inet manual

auto vmbr1
iface vmbr1 inet static
    bridge-ports bond0.2004
    bridge-stp off
    bridge-fd 0

auto vmbr2
iface vmbr2 inet static
    bridge-ports bond0
    bridge-stp off
    bridge-fd 0

iface eno8303 inet manual
iface eno8403 inet manual

source /etc/network/interfaces.d/*
interface names are pinned to MAC via udev.
The question is if there is a way to make dashboard workable with our network config?
I've tried to remove/reset rrd database like rm /var/lib/rrdcached/db/pve2-node/<node_name>. Tried to manipulate DS in the rrd DB. But nothing was working.
One step of thinking to populate metrics manually via cron like rrdtool update "$RRD_FILE" N:$update_str, but it is too much

