D dnoriega New Member Aug 8, 2024 8 0 1 Oct 3, 2024 #1 I can't find any information about the real units used to display the Graph of the Network Traffic Monitor. Currently one of my servers shows 7M, and I want to know if that is taking 7% or 70% of my 100Mbps ethernet infrastructure.
I can't find any information about the real units used to display the Graph of the Network Traffic Monitor. Currently one of my servers shows 7M, and I want to know if that is taking 7% or 70% of my 100Mbps ethernet infrastructure.
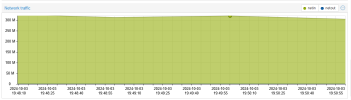
W waltar Famous Member Jul 29, 2024 1,855 576 118 Oct 3, 2024 #2 Node network graph is showing Megabytes/s and you can see with eg. "sar -n DEV 1 --iface=enp1s0" (sysstat package) maybe with interface also : 07:49:25 PM IFACE rxpck/s txpck/s rxkB/s txkB/s rxcmp/s txcmp/s rxmcst/s %ifutil 07:49:26 PM enp1s0 207385.00 6074.00 306226.65 491.32 0.00 0.00 0.00 25.09 07:49:26 PM IFACE rxpck/s txpck/s rxkB/s txkB/s rxcmp/s txcmp/s rxmcst/s %ifutil 07:49:27 PM enp1s0 257612.00 5588.00 380370.25 433.90 0.00 0.00 0.00 31.16 07:49:27 PM IFACE rxpck/s txpck/s rxkB/s txkB/s rxcmp/s txcmp/s rxmcst/s %ifutil 07:49:28 PM enp1s0 216251.00 7037.00 319192.48 628.39 0.00 0.00 0.00 26.15 07:49:28 PM IFACE rxpck/s txpck/s rxkB/s txkB/s rxcmp/s txcmp/s rxmcst/s %ifutil 07:49:29 PM enp1s0 219300.00 5530.00 323638.66 441.75 0.00 0.00 0.00 26.51 Attachments network_graph.png 14.5 KB · Views: 104
Node network graph is showing Megabytes/s and you can see with eg. "sar -n DEV 1 --iface=enp1s0" (sysstat package) maybe with interface also : 07:49:25 PM IFACE rxpck/s txpck/s rxkB/s txkB/s rxcmp/s txcmp/s rxmcst/s %ifutil 07:49:26 PM enp1s0 207385.00 6074.00 306226.65 491.32 0.00 0.00 0.00 25.09 07:49:26 PM IFACE rxpck/s txpck/s rxkB/s txkB/s rxcmp/s txcmp/s rxmcst/s %ifutil 07:49:27 PM enp1s0 257612.00 5588.00 380370.25 433.90 0.00 0.00 0.00 31.16 07:49:27 PM IFACE rxpck/s txpck/s rxkB/s txkB/s rxcmp/s txcmp/s rxmcst/s %ifutil 07:49:28 PM enp1s0 216251.00 7037.00 319192.48 628.39 0.00 0.00 0.00 26.15 07:49:28 PM IFACE rxpck/s txpck/s rxkB/s txkB/s rxcmp/s txcmp/s rxmcst/s %ifutil 07:49:29 PM enp1s0 219300.00 5530.00 323638.66 441.75 0.00 0.00 0.00 26.51
D dnoriega New Member Aug 8, 2024 8 0 1 Oct 3, 2024 #3 Just to make sure, in that graph, basically you are using a 2.5 Gbit port at its full capacity? And then I am using 7MB/s or 56 Mbps, approx 60% of my available bandwidth. Thanks a lot.
Just to make sure, in that graph, basically you are using a 2.5 Gbit port at its full capacity? And then I am using 7MB/s or 56 Mbps, approx 60% of my available bandwidth. Thanks a lot.
W waltar Famous Member Jul 29, 2024 1,855 576 118 Oct 3, 2024 #4 No, that's a nfs mount with 10Gb from a raidz1 3x2TB with iso files copied to /dev/null just for made some demo traffic.
No, that's a nfs mount with 10Gb from a raidz1 3x2TB with iso files copied to /dev/null just for made some demo traffic.