Monitoring Proxmox

hencebilal

Member
Nov 25, 2021
36
0
11
51
I installed proxmox server and I added a single node where there are several VMs, I want to target my Pve node with Grafana via prometheus (or you can suggest other solutions),


is there a guide to make it , i need help ??


Thanks you
 
Thanks you Dunuin !

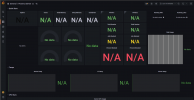
Unfortunately, i followed the guide step by step , the most interesting metrics give a value like “N / A” at the end.

and i don't get any output on “show measurements” ... :confused:


1647337301354.png
 
I ran into the same problem few weeks ago. If i remember right, i needed to upgrade grafana as the older version of grafana won't support the queries, provided by the dashboard
 
This is awesome!!

Question for you - what benefit(s) does this solution provide over Grafana and influxdb and exporting PVE stats, vs having to install vmagent on each proxmox host node?
InfluxDB provides for free only single node installation when VictoriaMetrics provide Cluster as well as Single Node. See more benefits on https://docs.victoriametrics.com/Single-server-VictoriaMetrics.html#prominent-features

As for vmagent - you can send metrics to VictoriaMetrics Single/Cluster without vmagent, I'm use it there because it can scrape metrics from other exporters like node_exporter and https://github.com/prometheus-pve/prometheus-pve-exporter .
 
Last edited:
  • Like
Reactions: hencebilal

About

The Proxmox community has been around for many years and offers help and support for Proxmox VE, Proxmox Backup Server, and Proxmox Mail Gateway.
We think our community is one of the best thanks to people like you!

Get your subscription!

The Proxmox team works very hard to make sure you are running the best software and getting stable updates and security enhancements, as well as quick enterprise support. Tens of thousands of happy customers have a Proxmox subscription. Get yours easily in our online shop.

Buy now!