Many ksoftirqd daemons using 99% of I/O
- Thread starter kristian.kirilov
- Start date
You are using an out of date browser. It may not display this or other websites correctly.
You should upgrade or use an alternative browser.
You should upgrade or use an alternative browser.
Hi,
same problem here.
root@proxmox03:~# pveversion -v
proxmox-ve: 5.1-25 (running kernel: 4.13.4-1-pve)
pve-manager: 5.1-35 (running version: 5.1-35/722cc488)
pve-kernel-4.13.4-1-pve: 4.13.4-25
libpve-http-server-perl: 2.0-6
lvm2: 2.02.168-pve6
corosync: 2.4.2-pve3
libqb0: 1.0.1-1
pve-cluster: 5.0-15
qemu-server: 5.0-17
pve-firmware: 2.0-3
libpve-common-perl: 5.0-20
libpve-guest-common-perl: 2.0-13
libpve-access-control: 5.0-7
libpve-storage-perl: 5.0-16
pve-libspice-server1: 0.12.8-3
vncterm: 1.5-2
pve-docs: 5.1-12
pve-qemu-kvm: 2.9.1-2
pve-container: 2.0-17
pve-firewall: 3.0-3
pve-ha-manager: 2.0-3
ksm-control-daemon: 1.2-2
glusterfs-client: 3.8.8-1
lxc-pve: 2.1.0-2
lxcfs: 2.0.7-pve4
criu: 2.11.1-1~bpo90
novnc-pve: 0.6-4
smartmontools: 6.5+svn4324-1
zfsutils-linux: 0.7.2-pve1~bpo90
openvswitch-switch: 2.6.2~pre+git20161223-3
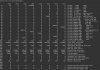
On this machine which i show the picture, i'm using local lvm storage, with software raid. Four disks with RAID6, then LVM as LVM thin-pool.
But i have this issue with different server, which use different technology: HBA's, shared volume presented by Storage, gfs2, clvmd, pacemaker/corosync.
I can show the interrupts from other servers, if you want.
But i have this issue with different server, which use different technology: HBA's, shared volume presented by Storage, gfs2, clvmd, pacemaker/corosync.
I can show the interrupts from other servers, if you want.
[48719.602582] perf: interrupt took too long (2515 > 2500), lowering kernel.perf_event_max_sample_rate to 79500
[70360.987751] perf: interrupt took too long (3148 > 3143), lowering kernel.perf_event_max_sample_rate to 63500
[105536.021584] perf: interrupt took too long (4027 > 3935), lowering kernel.perf_event_max_sample_rate to 49500
[208735.997048] perf: interrupt took too long (5036 > 5033), lowering kernel.perf_event_max_sample_rate to 39500
What about that? Isn't it related for interrupts? Sorry i don't have deep kernel understanding skills, i'm just guessing. I try to be helpful.