I am running a small cluster (3 x AMD EPYC 7313P, 448GB RAM, 10 x PCI 4.0 Enterprise NVMe drives in a RAIDZ2-0 array with PVE 8.2.3) with all three nodes set up using 2 bonded 10Gbps fiber connections for migrations and admin.
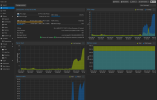
I am running into an issue where one of the three nodes is intermittently running really high IO Delay numbers (30-50% at times) while the two identical servers running the same load have an IO Delay of 0.03% pretty much all the time. I am pretty sure it isn't specific VM related as I have moved all the VMs off of that node and put different ones on it, and the issue persists.
The problem is especially bad during backup (Proxmox Backup Server and NFS Storage server) and during migration of VMs. About 2 minutes after a task finishes, IO Delay drops back down again.
Aug 29 16:17:12 c51 pmxcfs[5680]: [status] notice: received log
Aug 29 16:17:28 c51 corosync[5783]: [KNET ] link: host: 1 link: 0 is down
Aug 29 16:17:28 c51 corosync[5783]: [KNET ] host: host: 1 (passive) best link: 0 (pri: 1)
Aug 29 16:17:28 c51 corosync[5783]: [KNET ] host: host: 1 has no active links
Aug 29 16:17:30 c51 corosync[5783]: [KNET ] rx: host: 1 link: 0 is up
Aug 29 16:17:30 c51 corosync[5783]: [KNET ] link: Resetting MTU for link 0 because host 1 joined
Aug 29 16:17:30 c51 corosync[5783]: [KNET ] host: host: 1 (passive) best link: 0 (pri: 1)
Aug 29 16:17:30 c51 corosync[5783]: [KNET ] pmtud: Global data MTU changed to: 1397
Aug 29 16:19:28 c51 corosync[5783]: [KNET ] link: host: 1 link: 0 is down
Aug 29 16:19:28 c51 corosync[5783]: [KNET ] host: host: 1 (passive) best link: 0 (pri: 1)
Aug 29 16:19:28 c51 corosync[5783]: [KNET ] host: host: 1 has no active links
Aug 29 16:19:30 c51 corosync[5783]: [KNET ] rx: host: 1 link: 0 is up
Aug 29 16:19:30 c51 corosync[5783]: [KNET ] link: Resetting MTU for link 0 because host 1 joined
Aug 29 16:19:30 c51 corosync[5783]: [KNET ] host: host: 1 (passive) best link: 0 (pri: 1)
Aug 29 16:19:30 c51 corosync[5783]: [KNET ] pmtud: Global data MTU changed to: 1397
Aug 29 16:24:57 c51 corosync[5783]: [KNET ] link: host: 1 link: 0 is down
Aug 29 16:24:57 c51 corosync[5783]: [KNET ] host: host: 1 (passive) best link: 0 (pri: 1)
Aug 29 16:24:57 c51 corosync[5783]: [KNET ] host: host: 1 has no active links
Aug 29 16:24:59 c51 corosync[5783]: [KNET ] rx: host: 1 link: 0 is up
Aug 29 16:24:59 c51 corosync[5783]: [KNET ] link: Resetting MTU for link 0 because host 1 joined
Aug 29 16:24:59 c51 corosync[5783]: [KNET ] host: host: 1 (passive) best link: 0 (pri: 1)
Aug 29 16:24:59 c51 corosync[5783]: [KNET ] pmtud: Global data MTU changed to: 1397
Aug 29 16:26:14 c51 pmxcfs[5680]: [dcdb] notice: data verification successful
Aug 29 16:26:56 c51 corosync[5783]: [KNET ] link: host: 1 link: 0 is down
Aug 29 16:26:56 c51 corosync[5783]: [KNET ] host: host: 1 (passive) best link: 0 (pri: 1)
Aug 29 16:26:56 c51 corosync[5783]: [KNET ] host: host: 1 has no active links
Aug 29 16:26:58 c51 corosync[5783]: [KNET ] rx: host: 1 link: 0 is up
Aug 29 16:26:58 c51 corosync[5783]: [KNET ] link: Resetting MTU for link 0 because host 1 joined
Aug 29 16:26:58 c51 corosync[5783]: [KNET ] host: host: 1 (passive) best link: 0 (pri: 1)
Aug 29 16:26:59 c51 corosync[5783]: [KNET ] pmtud: Global data MTU changed to: 1397
Aug 29 16:26:59 c51 corosync[5783]: [TOTEM ] Token has not been received in 2737 ms
I am running into an issue where one of the three nodes is intermittently running really high IO Delay numbers (30-50% at times) while the two identical servers running the same load have an IO Delay of 0.03% pretty much all the time. I am pretty sure it isn't specific VM related as I have moved all the VMs off of that node and put different ones on it, and the issue persists.
The problem is especially bad during backup (Proxmox Backup Server and NFS Storage server) and during migration of VMs. About 2 minutes after a task finishes, IO Delay drops back down again.
- Are there any tools available for diagnosing the issue?
- Is IO Delay specifically limited to the disk io speed, or could this be a network card issue?
- Disks are about 2 years old, issue has only been noticed over the last few months. None of the disks are reporting more than 9% wear.
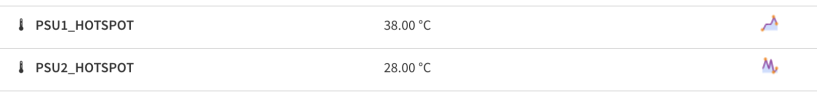
- I suspect a heat throttling issue more than anything else, but I would greatly appreciate any words of wisdom.
- I am seeing some odd logs showing up that look like the corosync network is going up and down, but I can't see any actual connection issues. Example below.
Aug 29 16:17:12 c51 pmxcfs[5680]: [status] notice: received log
Aug 29 16:17:28 c51 corosync[5783]: [KNET ] link: host: 1 link: 0 is down
Aug 29 16:17:28 c51 corosync[5783]: [KNET ] host: host: 1 (passive) best link: 0 (pri: 1)
Aug 29 16:17:28 c51 corosync[5783]: [KNET ] host: host: 1 has no active links
Aug 29 16:17:30 c51 corosync[5783]: [KNET ] rx: host: 1 link: 0 is up
Aug 29 16:17:30 c51 corosync[5783]: [KNET ] link: Resetting MTU for link 0 because host 1 joined
Aug 29 16:17:30 c51 corosync[5783]: [KNET ] host: host: 1 (passive) best link: 0 (pri: 1)
Aug 29 16:17:30 c51 corosync[5783]: [KNET ] pmtud: Global data MTU changed to: 1397
Aug 29 16:19:28 c51 corosync[5783]: [KNET ] link: host: 1 link: 0 is down
Aug 29 16:19:28 c51 corosync[5783]: [KNET ] host: host: 1 (passive) best link: 0 (pri: 1)
Aug 29 16:19:28 c51 corosync[5783]: [KNET ] host: host: 1 has no active links
Aug 29 16:19:30 c51 corosync[5783]: [KNET ] rx: host: 1 link: 0 is up
Aug 29 16:19:30 c51 corosync[5783]: [KNET ] link: Resetting MTU for link 0 because host 1 joined
Aug 29 16:19:30 c51 corosync[5783]: [KNET ] host: host: 1 (passive) best link: 0 (pri: 1)
Aug 29 16:19:30 c51 corosync[5783]: [KNET ] pmtud: Global data MTU changed to: 1397
Aug 29 16:24:57 c51 corosync[5783]: [KNET ] link: host: 1 link: 0 is down
Aug 29 16:24:57 c51 corosync[5783]: [KNET ] host: host: 1 (passive) best link: 0 (pri: 1)
Aug 29 16:24:57 c51 corosync[5783]: [KNET ] host: host: 1 has no active links
Aug 29 16:24:59 c51 corosync[5783]: [KNET ] rx: host: 1 link: 0 is up
Aug 29 16:24:59 c51 corosync[5783]: [KNET ] link: Resetting MTU for link 0 because host 1 joined
Aug 29 16:24:59 c51 corosync[5783]: [KNET ] host: host: 1 (passive) best link: 0 (pri: 1)
Aug 29 16:24:59 c51 corosync[5783]: [KNET ] pmtud: Global data MTU changed to: 1397
Aug 29 16:26:14 c51 pmxcfs[5680]: [dcdb] notice: data verification successful
Aug 29 16:26:56 c51 corosync[5783]: [KNET ] link: host: 1 link: 0 is down
Aug 29 16:26:56 c51 corosync[5783]: [KNET ] host: host: 1 (passive) best link: 0 (pri: 1)
Aug 29 16:26:56 c51 corosync[5783]: [KNET ] host: host: 1 has no active links
Aug 29 16:26:58 c51 corosync[5783]: [KNET ] rx: host: 1 link: 0 is up
Aug 29 16:26:58 c51 corosync[5783]: [KNET ] link: Resetting MTU for link 0 because host 1 joined
Aug 29 16:26:58 c51 corosync[5783]: [KNET ] host: host: 1 (passive) best link: 0 (pri: 1)
Aug 29 16:26:59 c51 corosync[5783]: [KNET ] pmtud: Global data MTU changed to: 1397
Aug 29 16:26:59 c51 corosync[5783]: [TOTEM ] Token has not been received in 2737 ms