InfluxDB, Graphana, Promox

Melanxolik

Well-Known Member
Dec 18, 2013
86
0
46
Hi All.

I am working on integration proxmox for our monitoring which based on graphana, we are using unfluxdb.

Probably does somebody has dashboards? I tried to create several dashboards, but faced with a lot of problems when started working on a nics table.
 
hi,
yes i use grafana for a dashboard,
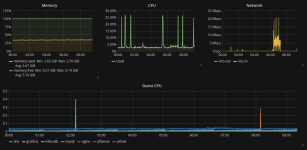
here the proxmox relevant graphs i use:
grafana.png

tried to create several dashboards, but faced with a lot of problems when started working on a nics table.
what exactly did you try, and what did not work?
 
We also use influx with proxmox. Unfortunately the data model (esp. units for measurements) isn't documented, so I had to look into the source code for reverse engineering. I'm planning to update the wiki page.

enda-pve-kvm-dashboard-png.5485
 

Attachments

  • enda-pve-kvm-dashboard.png
    enda-pve-kvm-dashboard.png
    248.3 KB · Views: 606
  • Like
Reactions: dcsapak
We also use influx with proxmox. Unfortunately the data model (esp. units for measurements) isn't documented, so I had to look into the source code for reverse engineering. I'm planning to update the wiki page.

Look really cool, could you please share your dashboard? I tried use this query for build graph for net:
Code:
SELECT mean("netout") FROM "nics" WHERE object = 'qemu' and  netout > 9000000000 and $timeFilter GROUP BY time($__interval),host,vmid fill(null)
but it had problem with timedelta, after that I changed query to:
Code:
SELECT DERIVATIVE("netin") FROM "nics" WHERE "vmid" = '$vmid'  and $timeFilter
but it didn't provide me good info too....
 
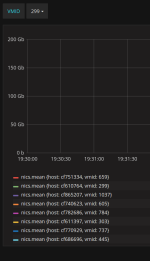
Look cool, but one question, does it possible to show instance name near vmid on the right?

When I used query:
Code:
SELECT mean("netout") FROM "nics" WHERE object = 'qemu' and  netout > 9000000000 and $timeFilter GROUP BY time($__interval),host,vmid fill(null)
it gave me detail information about virtual instance name
 

Attachments

  • Снимок экрана от 2017-07-13 19-45-00.png
    Снимок экрана от 2017-07-13 19-45-00.png
    58.5 KB · Views: 98
hi,
yes i use grafana for a dashboard,
here the proxmox relevant graphs i use:

what exactly did you try, and what did not work?

Cool dashboard too, I just tried create something similar but I got problem with graph...

My graph for avg* has a lot of points, but doesn't have line. If I turn off option: Points, my graph will be empty without any lines. I can't undestand why.
 

Attachments

  • Снимок экрана от 2017-07-13 21-35-02.png
    Снимок экрана от 2017-07-13 21-35-02.png
    122.4 KB · Views: 69
Look cool, but one question, does it possible to show instance name near vmid on the right?

When I used query:
Code:
SELECT mean("netout") FROM "nics" WHERE object = 'qemu' and  netout > 9000000000 and $timeFilter GROUP BY time($__interval),host,vmid fill(null)
it gave me detail information about virtual instance name

Please find attached to this post a enhanced version.

N
 

Attachments

Cool dashboard too, I just tried create something similar but I got problem with graph...

My graph for avg* has a lot of points, but doesn't have line. If I turn off option: Points, my graph will be empty without any lines. I can't undestand why.

Sound like a problem with derivation / interval. Could you share your dashboard, so could I take a look.
 
nicalaiB
sorry, I didn't get your advice clear: (and change Query A measurement to load 1 - looks like a typo)
Code:
SELECT mean("avg5") FROM "cpustat" WHERE "host" =~ /^$node$/ and $timeFilter GROUP BY time($__interval),"avg5","host" fill(null)
could you please provide some example ?
 
Sorry, probably I didn't explain my question so clear, I just wanted ask about: How can I change description of parameter on the graph.
Example: from cpustat.mean {avg1:, cluster-3-1:} to simple: avg1.
I couldn't find this way to do it.

And if you see on the graph which show: dcsapak, he didn't have any label with world "mean"

Thank you for your helping.
 

Attachments

  • Screenshot 2017-07-14 15.00.14.png
    Screenshot 2017-07-14 15.00.14.png
    121.4 KB · Views: 126
this is done by the alias function for single values, or the alias field for a whole query
 
If you are using lastet version grafana you can do query:
Code:
SELECT derivative(mean("wr_bytes"), 1s) AS "$vmid" FROM "blockstat" WHERE "nodename" =~ /^$node$/ AND "vmid" =~ /^$vmid$/ AND $timeFilter GROUP BY time($__interval), "vmid","host" fill(null)
and filed: Alias BY: $tag_vmid $tag_host

After that you will have VMID +VMNAME on charts.