InfluxDB, Graphana, Promox

Melanxolik

Well-Known Member
Dec 18, 2013
86
0
46
Hi All.

I am working on integration proxmox for our monitoring which based on graphana, we are using unfluxdb.

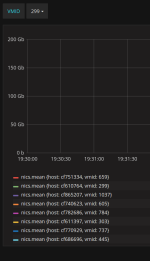
Probably does somebody has dashboards? I tried to create several dashboards, but faced with a lot of problems when started working on a nics table.
 
hi,
yes i use grafana for a dashboard,
here the proxmox relevant graphs i use:
grafana.png

tried to create several dashboards, but faced with a lot of problems when started working on a nics table.
what exactly did you try, and what did not work?
 
We also use influx with proxmox. Unfortunately the data model (esp. units for measurements) isn't documented, so I had to look into the source code for reverse engineering. I'm planning to update the wiki page.

enda-pve-kvm-dashboard-png.5485
 

Attachments

  • enda-pve-kvm-dashboard.png
    enda-pve-kvm-dashboard.png
    248.3 KB · Views: 598
  • Like
Reactions: dcsapak
We also use influx with proxmox. Unfortunately the data model (esp. units for measurements) isn't documented, so I had to look into the source code for reverse engineering. I'm planning to update the wiki page.

Look really cool, could you please share your dashboard? I tried use this query for build graph for net:
Code:
SELECT mean("netout") FROM "nics" WHERE object = 'qemu' and  netout > 9000000000 and $timeFilter GROUP BY time($__interval),host,vmid fill(null)
but it had problem with timedelta, after that I changed query to:
Code:
SELECT DERIVATIVE("netin") FROM "nics" WHERE "vmid" = '$vmid'  and $timeFilter
but it didn't provide me good info too....
 
Look cool, but one question, does it possible to show instance name near vmid on the right?

When I used query:
Code:
SELECT mean("netout") FROM "nics" WHERE object = 'qemu' and  netout > 9000000000 and $timeFilter GROUP BY time($__interval),host,vmid fill(null)
it gave me detail information about virtual instance name
 

Attachments

  • Снимок экрана от 2017-07-13 19-45-00.png
    Снимок экрана от 2017-07-13 19-45-00.png
    58.5 KB · Views: 97
hi,
yes i use grafana for a dashboard,
here the proxmox relevant graphs i use:

what exactly did you try, and what did not work?

Cool dashboard too, I just tried create something similar but I got problem with graph...

My graph for avg* has a lot of points, but doesn't have line. If I turn off option: Points, my graph will be empty without any lines. I can't undestand why.
 

Attachments

  • Снимок экрана от 2017-07-13 21-35-02.png
    Снимок экрана от 2017-07-13 21-35-02.png
    122.4 KB · Views: 68
Look cool, but one question, does it possible to show instance name near vmid on the right?

When I used query:
Code:
SELECT mean("netout") FROM "nics" WHERE object = 'qemu' and  netout > 9000000000 and $timeFilter GROUP BY time($__interval),host,vmid fill(null)
it gave me detail information about virtual instance name

Please find attached to this post a enhanced version.

N
 

Attachments

  • enda-pve-kvm-dashboard.json.txt
    25.5 KB · Views: 108
Cool dashboard too, I just tried create something similar but I got problem with graph...

My graph for avg* has a lot of points, but doesn't have line. If I turn off option: Points, my graph will be empty without any lines. I can't undestand why.

Sound like a problem with derivation / interval. Could you share your dashboard, so could I take a look.
 
yes, please. It will be cool if you can find problem
 

Attachments

  • proxmox.nodes.json.txt
    7.3 KB · Views: 68
nicalaiB
sorry, I didn't get your advice clear: (and change Query A measurement to load 1 - looks like a typo)
Code:
SELECT mean("avg5") FROM "cpustat" WHERE "host" =~ /^$node$/ and $timeFilter GROUP BY time($__interval),"avg5","host" fill(null)
could you please provide some example ?
 
Sorry, probably I didn't explain my question so clear, I just wanted ask about: How can I change description of parameter on the graph.
Example: from cpustat.mean {avg1:, cluster-3-1:} to simple: avg1.
I couldn't find this way to do it.

And if you see on the graph which show: dcsapak, he didn't have any label with world "mean"

Thank you for your helping.
 

Attachments

  • Screenshot 2017-07-14 15.00.14.png
    Screenshot 2017-07-14 15.00.14.png
    121.4 KB · Views: 125
this is done by the alias function for single values, or the alias field for a whole query
 
If you are using lastet version grafana you can do query:
Code:
SELECT derivative(mean("wr_bytes"), 1s) AS "$vmid" FROM "blockstat" WHERE "nodename" =~ /^$node$/ AND "vmid" =~ /^$vmid$/ AND $timeFilter GROUP BY time($__interval), "vmid","host" fill(null)
and filed: Alias BY: $tag_vmid $tag_host

After that you will have VMID +VMNAME on charts.
 

About

The Proxmox community has been around for many years and offers help and support for Proxmox VE, Proxmox Backup Server, and Proxmox Mail Gateway.
We think our community is one of the best thanks to people like you!

Get your subscription!

The Proxmox team works very hard to make sure you are running the best software and getting stable updates and security enhancements, as well as quick enterprise support. Tens of thousands of happy customers have a Proxmox subscription. Get yours easily in our online shop.

Buy now!