Influx: calculate outbound traffic

pRieStaKos

New Member
Nov 12, 2020
8
1
3
Athens
www.massivegrid.com
Hello,
I've setup an influxDB server to collect proxmox data and I want to calculate the daily outbound traffic from every VM.
I'm using this query and I want to verify that the number I'm getting is the correct one, so I can update my ERP and check if bw usage has been extended.

SELECT LAST(transmit) - FIRST(transmit) as traffic FROM nics WHERE time >= now() - 24h AND host='{HOST}' AND instance = 'tap{VMID}i0'

I'm getting a number like 62294934 which I can get is in bytes and I want to verify somehow that this is the correct number, so I can add it in the overall bw usage of client's service, along with other service VMs.

Any guidance is much appreciated.

Thank you in advance.
 
I think is better to query netin,netout on VM host name and vmid and make the calculations

SELECT SUM(netin) AS netin, SUM(netout) AS netout FROM nics WHERE host='{HOST}' AND vmid='{VMID}' AND time >= now() - 24h.
 
  • Like
Reactions: spirit
How to archive traffic stats for InfluxDB 2 / Flux Language for every host?

My query looks like:

Code:
from(bucket: "proxmox-cluster-03")
  |> range(start: v.timeRangeStart, stop: v.timeRangeStop)
  |> filter(fn: (r) => r["_measurement"] == "nics")
  |> filter(fn: (r) => r["_field"] == "netin" or r["_field"] == "netout")
  |> filter(fn: (r) => r["instance"] == "tap150i0")
  |> derivative(unit: 1s, nonNegative: false)
  |> yield(name: "derivative")
  |> aggregateWindow(every: 1d, fn: sum)

Generated results are not grouped by 1d (aggregateWindow) and seems to be wrong.
 
For VM traffic analyses per virtual machine the InfluxDB 2 query could look like:

Code:
from(bucket: "proxmox-cluster-xx")
  // Query Builder Webinterface - Format: Y-m-dTH:00:00Z
  |> range(start: v.timeRangeStart, stop: v.timeRangeStop)
 
 
  |> filter(fn: (r) => r["_measurement"] == "nics")
  //|> filter(fn: (r) => r["_field"] == "netout")
  //|> filter(fn: (r) => r["_field"] == "netin")
 
  // Get traffic by tap adapter:
  |> filter(fn: (r) => r["instance"] == "tapXXXXXi0")
 
  // Get traffic by VM ID:
  |> filter(fn: (r) => r["vmid"] == "100")
 
  // Get traffic by VM hostname (proxmox guest name):
  |> filter(fn: (r) => r["vmid"] == "proxmox-guest-fqdn")
 
 
  // Aggregate by hours (h), minutes (m), days (d)
  |> aggregateWindow(every: 1h, fn: last, createEmpty: true)
 
  // Important: Proxmox pushing always virtual nic counters so the difference to the last
  // measurement has to be substracted.
  |> difference()

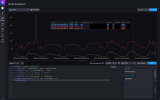
Result (InfluxDB Webinterface):

proxmox-influx-vm-traffic.png
 
Last edited:
  • Like
Reactions: rolandmade