Increase in IO pressure after 9.2.3 update

deebsr

New Member
Nov 17, 2025
25
12
3
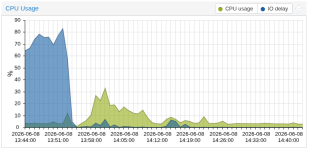
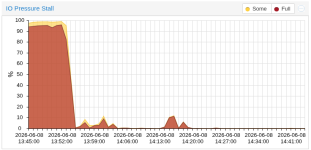
After updating a host from 9.1.4 > 9.2.3 I'm noticing that there is now a noticeable increase in IO pressure.

Update was done an host rebooting at around 2026-06-01@13:00

1780419483346.png

Same thing with IO Delay:

1780419595021.png

Anyone else who have updated have the same issue?


Thanks for your help
 
For me its even worse. 70% to 90% IO delay with round about 95% Full IO Pressure on all VMs. Interestingly I don't see IO Pressure on the LXC containers.

iostat shows the iowait as well but the values do not reflect this high utilization rate IMHO:

Code:
avg-cpu:  %user   %nice %system %iowait  %steal   %idle
           1.11    0.00    0.41   92.45    0.00    6.04

Device             tps    MB_read/s    MB_wrtn/s    MB_dscd/s    MB_read    MB_wrtn    MB_dscd
nvme0n1          77.50         0.00         0.41         0.00          0          0          0
sda               7.50         0.00         0.04         0.00          0          0          0


avg-cpu:  %user   %nice %system %iowait  %steal   %idle
           1.23    0.00    0.88   91.85    0.00    6.04

Device             tps    MB_read/s    MB_wrtn/s    MB_dscd/s    MB_read    MB_wrtn    MB_dscd
nvme0n1          16.50         0.00         0.07         0.00          0          0          0
sda               6.00         0.00         0.02         0.00          0          0          0


avg-cpu:  %user   %nice %system %iowait  %steal   %idle
           1.23    0.00    0.38   92.33    0.00    6.06

Device             tps    MB_read/s    MB_wrtn/s    MB_dscd/s    MB_read    MB_wrtn    MB_dscd
nvme0n1          17.50         0.00         0.09         0.00          0          0          0
sda               0.50         0.00         0.00         0.00          0          0          0

Code:
# pveversion --verbose
proxmox-ve: 9.2.0 (running kernel: 6.14.11-9-pve)
pve-manager: 9.2.3 (running version: 9.2.3/d0fde103346cf89a)
proxmox-kernel-helper: 9.2.0
proxmox-kernel-7.0: 7.0.6-2
proxmox-kernel-7.0.6-2-pve-signed: 7.0.6-2
proxmox-kernel-7.0.0-3-pve-signed: 7.0.0-3
proxmox-kernel-6.17: 6.17.13-13
proxmox-kernel-6.17.13-13-pve-signed: 6.17.13-13
proxmox-kernel-6.14: 6.14.11-9
proxmox-kernel-6.14.11-9-pve-signed: 6.14.11-9
proxmox-kernel-6.14.11-5-pve-signed: 6.14.11-5
proxmox-kernel-6.14.8-2-pve: 6.14.8-2
proxmox-kernel-6.8.12-17-pve: 6.8.12-17
proxmox-kernel-6.8: 6.8.12-17
amd64-microcode: 3.20251202.1~bpo13+1
ceph-fuse: 19.2.3-pve1
corosync: 3.1.10-pve2
criu: 4.1.1-1
frr-pythontools: 10.6.1-1+pve2
ifupdown2: 3.3.0-1+pmx12
ksm-control-daemon: 1.5-1
libjs-extjs: 7.0.0-5
libproxmox-acme-perl: 1.7.1
libproxmox-backup-qemu0: 2.0.2
libproxmox-rs-perl: 0.4.1
libpve-access-control: 9.1.1
libpve-apiclient-perl: 3.4.2
libpve-cluster-api-perl: 9.1.6
libpve-cluster-perl: 9.1.6
libpve-common-perl: 9.1.13
libpve-guest-common-perl: 6.0.3
libpve-http-server-perl: 6.0.5
libpve-network-perl: 1.6.6
libpve-notify-perl: 9.1.6
libpve-rs-perl: 0.15.3
libpve-storage-perl: 9.1.5
libspice-server1: 0.15.2-1+b1
lvm2: 2.03.31-2+pmx1
lxc-pve: 7.0.0-2
lxcfs: 7.0.0-pve1
novnc-pve: 1.7.0-1
proxmox-backup-client: 4.2.1-1
proxmox-backup-file-restore: 4.2.1-1
proxmox-backup-restore-image: 1.0.0
proxmox-firewall: 1.2.3
proxmox-kernel-helper: 9.2.0
proxmox-mail-forward: 1.0.3
proxmox-mini-journalreader: 1.6
proxmox-offline-mirror-helper: 0.7.4
proxmox-widget-toolkit: 5.2.3
pve-cluster: 9.1.6
pve-container: 6.1.10
pve-docs: 9.2.2
pve-edk2-firmware: 4.2025.05-2
pve-esxi-import-tools: 1.0.1
pve-firewall: 6.0.4
pve-firmware: 3.18-4
pve-ha-manager: 5.2.4
pve-i18n: 3.7.5
pve-qemu-kvm: 11.0.0-4
pve-xtermjs: 6.0.0-1
qemu-server: 9.1.16
smartmontools: 7.5-pve2
spiceterm: 3.4.2
swtpm: 0.8.0+pve3
vncterm: 1.9.2
zfsutils-linux: 2.4.2-pve1
 
Last edited:
This is a random screenshot of top. I really cannot find any hint what may cause this high iowait. There is just nothing doing heavy io on my server.
screenshot-top.png
 
Hi @deebsr,
please see:
 
Last edited:
  • Like
Reactions: deebsr
Hi @_derTim,
but it shouldn't be this high unless your guests are actually under pressure. Is the issue still present with newer kernels, i.e. 6.17 or 7.0? Please share your /etc/pve/storage.cfg and example VM configuration(s). What kind of workload is running in the guests?
 
Hey @fiona, thanks for your reply. All VMs are affected by this issue, from databases to Home Assistant to web servers or DNS. The workload does not matter.
Since I'll be away for a few days and haven't noticed any significant drop in performance, I'll provide the information early next week.
 
Last edited:
  • Like
Reactions: fiona
Hi @deebsr,
please see:
@fiona Ok good to know....Just curious as to what would be acceptable IO Delay? Is it still <=5%? or has this changed?
Can we still have spikes that go over 5% briefly? or is this still not a good sign?
 
Last edited:
Hi @deebsr,
please see:
@fiona Thanks for the reply.....I was wondering if this kind of thing should be called out in release notes just so others are aware of this change when they update? It seems to be a fundamental shift in how this is reported and seeing a sudden jump could lead to lots of support calls for you team.
 
I just checked all my upgraded nodes, most are less than 0.05% on IO pressure stall, and IO load barely cracks 1%, its at 0% most the time.

I'm running Epyc's (rome/milan) and 5950x's, guests are doing average workloads, storage tiers are all local nvmes with some via NVMe-oF.

In my case, I feel no difference between pre 9.2 and current.

Also have a couple 13500Ts and a bunch of 8500Ts, same, no issues.
 
If you don't see an actual performance regression, it's fine. It's just a metric after all, that's highly dependent on the concrete storage setup and workload. Again, it's just a different subsystem that's used and the accounting is done differently there. In fact, if io_uring is faster submitting requests, then the CPU might even wait a larger percentage of its time on the IO, just because it spends less time submitting ;) Still, the values from @_derTim do seem to high and should be investigated.