howto fix poor Windows 2016 Server performance

May 16, 2017
24
0
41
58
Hello,

I have a running Proxmox V5 on a HP ProLiant DL380p Gen8 with 96GB RAM and 2 Xeon CPU E5-2670 0 @ 2.60GHz. Storage is 8 x 3TB 7.2k SAS HDDs on a SmartArray P420i controller (in HBA mode for zfs).

The Proxmox system was installed on an SD card, the VM data is stored in a ZFS Raid (see below). I have installed a Windows 2016 server and set up RDS services.
The latest virtio drivers of RedHat have been installed and the system is running error-free. Nevertheless, if you log on the server remotely logs, everything very sluggish and the reloading of programs takes a long time - the felt performance for the user is inadequate.

1 question:
What tools do I need to use to find the cause of the error and how do I best work to maximize the performance?

2. Question:
Is it useful to reduce the zfs pool cache and install in the free space the Proxmox? If not - how can I then install the system on an additional SSD without losing the existing virtual machines?


Code:
root@sv-pve:~# zpool status -v
  pool: rz2pool
 state: ONLINE
  scan: scrub repaired 0 in 3h37m with 0 errors on Sun Aug 13 04:01:08 2017
config:

        NAME                                                      STATE     READ WRITE CKSUM
        rz2pool                                                   ONLINE       0     0     0
          raidz2-0                                                ONLINE       0     0     0
            scsi-35000cca01a834670                                ONLINE       0     0     0
            scsi-35000cca01a791e24                                ONLINE       0     0     0
            scsi-35000cca01a769f54                                ONLINE       0     0     0
            scsi-35000cca01a83cd30                                ONLINE       0     0     0
          raidz2-1                                                ONLINE       0     0     0
            scsi-35000cca01a841db0                                ONLINE       0     0     0
            scsi-35000cca01a832f30                                ONLINE       0     0     0
            scsi-35000cca01a69f22c                                ONLINE       0     0     0
            scsi-35000c50041ca84ab                                ONLINE       0     0     0
        logs
          mirror-2                                                ONLINE       0     0     0
            nvme-Samsung_SSD_960_EVO_250GB_S3ESNX0J315970N-part1  ONLINE       0     0     0
            nvme-Samsung_SSD_960_EVO_250GB_S3ESNX0J315973V-part1  ONLINE       0     0     0
        cache
          nvme-Samsung_SSD_960_EVO_250GB_S3ESNX0J315970N-part2    ONLINE       0     0     0
          nvme-Samsung_SSD_960_EVO_250GB_S3ESNX0J315973V-part2    ONLINE       0     0     0

errors: No known data errors

  pool: zspool
 state: ONLINE
  scan: scrub repaired 0 in 0h0m with 0 errors on Sun Aug 13 00:24:17 2017
config:

        NAME          STATE     READ WRITE CKSUM
        zspool        ONLINE       0     0     0
          mirror-0    ONLINE       0     0     0
            s1-part3  ONLINE       0     0     0
            s2-part3  ONLINE       0     0     0

errors: No known data errors


Code:
root@sv-pve:~# pvesm status
Name               Type     Status           Total            Used       Available        %
local               dir     active        14900200         7956460         6167140   53.40%
rz2pool-ct      zfspool     active      5947140075             139      5947139936    0.00%
rz2pool-iso         dir     active      5956548864         9409024      5947139840    0.16%
rz2pool-vm      zfspool     active     10941639743      4994499807      5947139936   45.65%


Code:
root@sv-pve:~# pveperf
CPU BOGOMIPS:      165988.80
REGEX/SECOND:      709588
HD SIZE:           14.21 GB (/dev/mapper/pve-root)
BUFFERED READS:    13.64 MB/sec
AVERAGE SEEK TIME: 93.60 ms
FSYNCS/SECOND:     28.10
DNS EXT:           36.27 ms
DNS INT:           1.24 ms (example.com)


Code:
root@sv-pve:~# pveperf /rz2pool/vm
CPU BOGOMIPS:      165988.80
REGEX/SECOND:      715164
HD SIZE:           5674.48 GB (rz2pool/vm)
FSYNCS/SECOND:     784.55
DNS EXT:           35.56 ms
DNS INT:           1.27 ms (example.com)
 
Last edited:
1 question:
Fio is the tool what you should use for raw testing.

use this here


Code:
zfs create -V 20G rz2pool/test
fio --filename=/dev/zvol/rz2pool/test --sync=1 --rw=write --bs=4k --numjobs=1 --iodepth=1 --runtime=120 --time_based --group_reporting --name=journal-test

2. Question:
I think your SSD are the Problem Samsung Consumer SSD have very bad sync write rates.
ZFS is doing only sync writes on a the ZIL.
But to your question it depends on the Memory how much you got.
 
OK thank you - so what kind of SSD I should buy for this? There is no drive bay left, so I would prefer a PCI express card.

btw. this is my test result of above suggested test:

Code:
journal-test: (g=0): rw=write, bs=4K-4K/4K-4K/4K-4K, ioengine=psync, iodepth=1
fio-2.16
Starting 1 process
Jobs: 1 (f=1): [W(1)] [100.0% done] [0KB/3376KB/0KB /s] [0/844/0 iops] [eta 00m:00s]
journal-test: (groupid=0, jobs=1): err= 0: pid=11204: Mon Sep  4 19:47:44 2017
  write: io=419284KB, bw=3494.4KB/s, iops=873, runt=120001msec
    clat (usec): min=715, max=15622, avg=1140.91, stdev=746.53
     lat (usec): min=715, max=15622, avg=1141.35, stdev=746.54
    clat percentiles (usec):
     |  1.00th=[  804],  5.00th=[  860], 10.00th=[  884], 20.00th=[  916],
     | 30.00th=[  940], 40.00th=[  956], 50.00th=[  972], 60.00th=[  996],
     | 70.00th=[ 1012], 80.00th=[ 1048], 90.00th=[ 1128], 95.00th=[ 1320],
     | 99.00th=[ 4512], 99.50th=[ 4576], 99.90th=[ 4768], 99.95th=[ 7712],
     | 99.99th=[ 8160]
    lat (usec) : 750=0.07%, 1000=63.77%
    lat (msec) : 2=31.47%, 4=0.02%, 10=4.66%, 20=0.01%
  cpu          : usr=0.62%, sys=9.86%, ctx=419461, majf=0, minf=47
  IO depths    : 1=100.0%, 2=0.0%, 4=0.0%, 8=0.0%, 16=0.0%, 32=0.0%, >=64=0.0%
     submit    : 0=0.0%, 4=100.0%, 8=0.0%, 16=0.0%, 32=0.0%, 64=0.0%, >=64=0.0%
     complete  : 0=0.0%, 4=100.0%, 8=0.0%, 16=0.0%, 32=0.0%, 64=0.0%, >=64=0.0%
     issued    : total=r=0/w=104821/d=0, short=r=0/w=0/d=0, drop=r=0/w=0/d=0
     latency   : target=0, window=0, percentile=100.00%, depth=1

Run status group 0 (all jobs):
  WRITE: io=419284KB, aggrb=3494KB/s, minb=3494KB/s, maxb=3494KB/s, mint=120001msec, maxt=120001msec

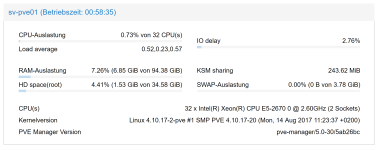
Here is my current dashboard during this test (all vms were down):Proxmox.PNG


And I did the same test on the root (pure SSD) ext4 filesystem
Code:
journal-test: (g=0): rw=write, bs=4K-4K/4K-4K/4K-4K, ioengine=psync, iodepth=1
fio-2.16
Starting 1 process
journal-test: you need to specify size=
fio: pid=0, err=22/file:filesetup.c:833, func=total_file_size, error=Invalid argument


Run status group 0 (all jobs):
root@sv-pve01:~# fio --filename=/test --sync=1 --rw=write --bs=4k --numjobs=1 --iodepth=1 --runtime=120 --time_based --group_reporting --name=journal-test --size=2G
journal-test: (g=0): rw=write, bs=4K-4K/4K-4K/4K-4K, ioengine=psync, iodepth=1
fio-2.16
Starting 1 process
journal-test: Laying out IO file(s) (1 file(s) / 2048MB)
Jobs: 1 (f=1): [W(1)] [100.0% done] [0KB/1540KB/0KB /s] [0/385/0 iops] [eta 00m:00s]
journal-test: (groupid=0, jobs=1): err= 0: pid=11622: Mon Sep  4 19:51:01 2017
  write: io=178592KB, bw=1488.3KB/s, iops=372, runt=120004msec
    clat (usec): min=1703, max=9843, avg=2682.10, stdev=770.60
     lat (usec): min=1704, max=9844, avg=2682.70, stdev=770.60
    clat percentiles (usec):
     |  1.00th=[ 2320],  5.00th=[ 2384], 10.00th=[ 2416], 20.00th=[ 2448],
     | 30.00th=[ 2480], 40.00th=[ 2480], 50.00th=[ 2512], 60.00th=[ 2544],
     | 70.00th=[ 2576], 80.00th=[ 2608], 90.00th=[ 2704], 95.00th=[ 2864],
     | 99.00th=[ 6112], 99.50th=[ 6176], 99.90th=[ 9408], 99.95th=[ 9536],
     | 99.99th=[ 9664]
    lat (msec) : 2=0.02%, 4=95.50%, 10=4.48%
  cpu          : usr=0.39%, sys=3.51%, ctx=89341, majf=0, minf=10
  IO depths    : 1=100.0%, 2=0.0%, 4=0.0%, 8=0.0%, 16=0.0%, 32=0.0%, >=64=0.0%
     submit    : 0=0.0%, 4=100.0%, 8=0.0%, 16=0.0%, 32=0.0%, 64=0.0%, >=64=0.0%
     complete  : 0=0.0%, 4=100.0%, 8=0.0%, 16=0.0%, 32=0.0%, 64=0.0%, >=64=0.0%
     issued    : total=r=0/w=44648/d=0, short=r=0/w=0/d=0, drop=r=0/w=0/d=0
     latency   : target=0, window=0, percentile=100.00%, depth=1

Run status group 0 (all jobs):
  WRITE: io=178592KB, aggrb=1488KB/s, minb=1488KB/s, maxb=1488KB/s, mint=120004msec, maxt=120004msec

Disk stats (read/write):
  nvme0n1: ios=14/133926, merge=0/71863, ticks=0/110580, in_queue=110516, util=92.15%
 
Last edited:
Here is a list of ssd and the sync performance.
I know this test is for ceph but caches works roughly similar.

https://www.sebastien-han.fr/blog/2...-if-your-ssd-is-suitable-as-a-journal-device/

Personal I would use a Intel Optane Memory 32GB.
They are very fast on 4kb write access about 11k on ZFS and have a good duration.

Also it would be interesting how fast your Spinner array are without zil.
You can benchmark it with the same test only increase the bs(blocksize) to 4M

About your cache there is no problem at the moment.
You have enough memory free. But keep in mind cache consume memory and with low memory you can slow the system down.
 
OK - so I ordered two Optane Modules an we'll see, what happens - I'll inform you about the result.

Here is the requested benchmark with 4M blocksize:
Code:
journal-test: (groupid=0, jobs=1): err= 0: pid=30815: Wed Sep  6 08:01:19 2017
  write: io=12424MB, bw=105998KB/s, iops=25, runt=120023msec
    clat (msec): min=18, max=228, avg=38.36, stdev=12.12
     lat (msec): min=19, max=228, avg=38.63, stdev=12.14
    clat percentiles (msec):
     |  1.00th=[   21],  5.00th=[   30], 10.00th=[   31], 20.00th=[   32],
     | 30.00th=[   33], 40.00th=[   36], 50.00th=[   38], 60.00th=[   40],
     | 70.00th=[   42], 80.00th=[   44], 90.00th=[   47], 95.00th=[   49],
     | 99.00th=[   83], 99.50th=[  108], 99.90th=[  198], 99.95th=[  206],
     | 99.99th=[  229]
    lat (msec) : 20=0.52%, 50=95.75%, 100=3.12%, 250=0.61%
  cpu          : usr=0.74%, sys=73.23%, ctx=16737, majf=0, minf=10361
  IO depths    : 1=100.0%, 2=0.0%, 4=0.0%, 8=0.0%, 16=0.0%, 32=0.0%, >=64=0.0%
     submit    : 0=0.0%, 4=100.0%, 8=0.0%, 16=0.0%, 32=0.0%, 64=0.0%, >=64=0.0%
     complete  : 0=0.0%, 4=100.0%, 8=0.0%, 16=0.0%, 32=0.0%, 64=0.0%, >=64=0.0%
     issued    : total=r=0/w=3106/d=0, short=r=0/w=0/d=0, drop=r=0/w=0/d=0
     latency   : target=0, window=0, percentile=100.00%, depth=1

Run status group 0 (all jobs):
  WRITE: io=12424MB, aggrb=105997KB/s, minb=105997KB/s, maxb=105997KB/s, mint=120023msec, maxt=120023msec

and for easy compare 4k again:
Code:
journal-test: (groupid=0, jobs=1): err= 0: pid=30429: Wed Sep  6 07:58:07 2017
  write: io=431052KB, bw=3592.8KB/s, iops=898, runt=120001msec
    clat (usec): min=700, max=517302, avg=1109.22, stdev=1739.11
     lat (usec): min=700, max=517304, avg=1109.75, stdev=1739.12
    clat percentiles (usec):
     |  1.00th=[  756],  5.00th=[  796], 10.00th=[  828], 20.00th=[  876],
     | 30.00th=[  908], 40.00th=[  924], 50.00th=[  948], 60.00th=[  964],
     | 70.00th=[  988], 80.00th=[ 1020], 90.00th=[ 1096], 95.00th=[ 1288],
     | 99.00th=[ 4448], 99.50th=[ 4512], 99.90th=[ 4768], 99.95th=[ 7840],
     | 99.99th=[10048]
    lat (usec) : 750=0.66%, 1000=74.07%
    lat (msec) : 2=20.65%, 4=0.02%, 10=4.59%, 20=0.01%, 750=0.01%
  cpu          : usr=0.56%, sys=9.77%, ctx=431195, majf=0, minf=57
  IO depths    : 1=100.0%, 2=0.0%, 4=0.0%, 8=0.0%, 16=0.0%, 32=0.0%, >=64=0.0%
     submit    : 0=0.0%, 4=100.0%, 8=0.0%, 16=0.0%, 32=0.0%, 64=0.0%, >=64=0.0%
     complete  : 0=0.0%, 4=100.0%, 8=0.0%, 16=0.0%, 32=0.0%, 64=0.0%, >=64=0.0%
     issued    : total=r=0/w=107763/d=0, short=r=0/w=0/d=0, drop=r=0/w=0/d=0
     latency   : target=0, window=0, percentile=100.00%, depth=1

Run status group 0 (all jobs):
  WRITE: io=431052KB, aggrb=3592KB/s, minb=3592KB/s, maxb=3592KB/s, mint=120001m                                                                 sec, maxt=120001msec

Code:
pveperf /rz2pool/vm
CPU BOGOMIPS:      165998.72
REGEX/SECOND:      1314297
HD SIZE:           971.41 GB (rz2pool/vm)
FSYNCS/SECOND:     896.54
DNS EXT:           31.80 ms
DNS INT:           0.93 ms (foo.bar.)
But could you please help me to understand the fio results with the different blocksizes according to my performance problem of the running windows server vm?

Thx
 
Last edited:
This test should find the raw capability of you storage.
Because you can not assume more speed in a VM as the underlying Storage can provide in raw.

ZFS use not always the ZIl. For instance on a large sequential write it will write direct to the storage and skip the ZIL.
This can be tested with large blocks like 4M.

And the 4k test is for small writes.

So this test means your HDD will write with 100MB seq sync write, what is not bad (do not compare with no sync this is much higher) and normal for this storage.

But the 4k writes are not very fast and will slow your system (VM) down when it comes to small writes.

The sync write is always the worse-case scenario and normally you have more Speed on this storage.
 
OK - so now I installed an Intel Octane 16GB module, reconfigured the zpool to use this as zlog and run those tests again - here are the results for those who are interested:

Test with Samsung EVO960 nvme as cache and Intel OPTANE 16GB as zlog

Code:
root@sv-pve01:/dev/disk/by-id# fio --filename=/dev/zvol/rz2pool/test --sync=1 --rw=write --bs=4k --numjobs=1 --iodepth=1 --runtime=120 --time_based --group_reporting --name=journal-test
journal-test: (g=0): rw=write, bs=4K-4K/4K-4K/4K-4K, ioengine=psync, iodepth=1
fio-2.16
Starting 1 process
Jobs: 1 (f=1): [f(1)] [100.0% done] [0KB/1700KB/0KB /s] [0/425/0 iops] [eta 00m:00s]
journal-test: (groupid=0, jobs=1): err= 0: pid=32760: Sun Sep 10 15:47:00 2017
  write: io=1396.4MB, bw=11916KB/s, iops=2978, runt=120001msec
    clat (usec): min=113, max=141913, avg=332.33, stdev=575.91
     lat (usec): min=113, max=141913, avg=332.72, stdev=575.92
    clat percentiles (usec):
     |  1.00th=[  119],  5.00th=[  137], 10.00th=[  161], 20.00th=[  197],
     | 30.00th=[  235], 40.00th=[  262], 50.00th=[  294], 60.00th=[  334],
     | 70.00th=[  374], 80.00th=[  426], 90.00th=[  494], 95.00th=[  556],
     | 99.00th=[  684], 99.50th=[  780], 99.90th=[ 5408], 99.95th=[12736],
     | 99.99th=[23680]
    lat (usec) : 250=35.80%, 500=54.66%, 750=8.95%, 1000=0.31%
    lat (msec) : 2=0.08%, 4=0.07%, 10=0.06%, 20=0.04%, 50=0.02%
    lat (msec) : 100=0.01%, 250=0.01%
  cpu          : usr=1.64%, sys=29.48%, ctx=894684, majf=0, minf=33
  IO depths    : 1=100.0%, 2=0.0%, 4=0.0%, 8=0.0%, 16=0.0%, 32=0.0%, >=64=0.0%
     submit    : 0=0.0%, 4=100.0%, 8=0.0%, 16=0.0%, 32=0.0%, 64=0.0%, >=64=0.0%
     complete  : 0=0.0%, 4=100.0%, 8=0.0%, 16=0.0%, 32=0.0%, 64=0.0%, >=64=0.0%
     issued    : total=r=0/w=357468/d=0, short=r=0/w=0/d=0, drop=r=0/w=0/d=0
     latency   : target=0, window=0, percentile=100.00%, depth=1

Run status group 0 (all jobs):
  WRITE: io=1396.4MB, aggrb=11915KB/s, minb=11915KB/s, maxb=11915KB/s, mint=120001msec, maxt=120001msec

Code:
root@sv-pve01:/dev/disk/by-id# pveperf /rz2pool/vm/
CPU BOGOMIPS:      165985.60
REGEX/SECOND:      947299
HD SIZE:           945.54 GB (rz2pool/vm)
FSYNCS/SECOND:     4151.47
DNS EXT:           31.36 ms
DNS INT:           0.99 ms (example.org.)

conclusion: fsync value increased from around 700 to around 4000 with the Intel OPTANE module - investment around 150€ for two of them + PCIE cards
 
but intel optane only have a TBW of 185 TB with 32 GB version, which will go quite fast with a slog I think..
 
but intel optane only have a TBW of 185 TB with 32 GB version, which will go quite fast with a slog I think..
Not all writes goes to the zil only the small one.
 

About

The Proxmox community has been around for many years and offers help and support for Proxmox VE, Proxmox Backup Server, and Proxmox Mail Gateway.
We think our community is one of the best thanks to people like you!

Get your subscription!

The Proxmox team works very hard to make sure you are running the best software and getting stable updates and security enhancements, as well as quick enterprise support. Tens of thousands of happy customers have a Proxmox subscription. Get yours easily in our online shop.

Buy now!