How to see logs of VIM in proxmox console

Ehud

New Member
Jan 8, 2024
3
0
1
Hello,

As I am new to Proxmox, I have a question.
I have installed the latest Proxmox version on the HP server.
After a while, my VM stopped responding, and I could not access it from the SSH and not from its web and not from proxmox GUI.
Can I see relevant logs only for this VMID from proxmox console?
I would like to understand if the server got stuck due to some incorrect configuration of proxmox as I could not find any issue in the VM itself (after hard reboot).
Thanks,
 
Hi Ehud,
could you give a bit more information about the system that was running inside the vm?
If the guest is a linux system, I would start by checking the journal of the last boot journalctl -b -1, you can also supply -e to jump directly to the end, as these can grow quite large.
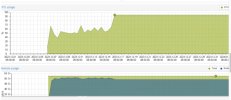
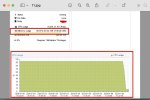
How was the resource usage of the vm when it locked up?

As for the host system (proxmox), I would look at the general logs for debugging. You can limit the output to the rough point at which the vm locked up: journalctl --since "2024-01-07"
 
Hi
Thanks, I will check that.
The server is HPE with 16 cores and 64G RAM.
The VM inside has 58G RAM and 6G left for the PRoxmox ( I think I can reduce it to 2G).
how do you suggest investigating it?
btw, with no proxmox, the issue does not happen...
 

Attachments

  • 12.jpg
    12.jpg
    497.7 KB · Views: 16
  • 11.jpg
    11.jpg
    369.9 KB · Views: 19
The memory usage may not be a bad thing, since the reporting includes the file system cache, which can grow quite large, but can be freed at any moment if needed.
It looks like the system locked up at a moment of high cpu usage, it might be interesting to look at the cpu/io/memory pressures of the affected vm, which can be found at /sys/fs/cgroup/qemu.slice/<vmid>.scope/{memory,cpu,io}.pressure.
 
Thanks for the feedback, I really appreciate it.
I have taken some info from another system I have:
And I see:
some avg10=0.00 avg60=0.00 avg300=0.00 total=762479696
full avg10=0.00 avg60=0.00 avg300=0.00 total=762478482
what do the values mean?
 
Was that taken at a moment where the VM was locked up?
The numbers describe the percentage of time that processes had to wait for a given resource.
The avg10 is in average over the last 10 seconds, avg60 is 60 seconds and so on. Total describes the overall time that had to be waited in microseconds [0].

[0] https://facebookmicrosites.github.io/psi/docs/overview
 

About

The Proxmox community has been around for many years and offers help and support for Proxmox VE, Proxmox Backup Server, and Proxmox Mail Gateway.
We think our community is one of the best thanks to people like you!

Get your subscription!

The Proxmox team works very hard to make sure you are running the best software and getting stable updates and security enhancements, as well as quick enterprise support. Tens of thousands of happy customers have a Proxmox subscription. Get yours easily in our online shop.

Buy now!