High data unites written / SSD wearout in Proxmox

ksl28

New Member
Aug 31, 2023
25
4
3
Hi everyone,

Happy new year :)

I have begun to see a disturbing trend in both my Proxmox VE nodes, that the M2 disks are wearing out rather fast.
Both nodes are identitical in the terms of hardware and configuration.
6.2.16-12-pve
2 x Samsung SSD 980 Pro 2TB (Only one in use on each node for now) - and both are configured with ext4
The nodes was installed on 2023-09-09

I will take the second node as the example (dk1pve02) - the VMs in the node is consuming about 500GB in total, and a lot of them are static.
Meaning that they will of course receive some updates, but my best guess is that we are talking 2-3GB per VM, per month.

When i look at the S.M.A.R.T info in PVE, it states that the disk is 2% weared out and a total of 8.82TB have been written.
On the 06-12-2023 that number was 6.40TB - so more that 2.4TB have been written since.
The 500GB 850 Pro disk is from a ESXi setup, that contained the same virtual machines - and over 4 years, it was 7% weared out.
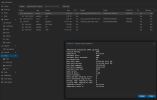
1704267511044.png


I honestly cant figure out what is performing all these writes, but i am fairly sure its not my virtual machines - given that they do nada.
I have tried my best to find a solution my self, and have read all about not to use ZFS on consumer disks (which i am not), etc.

How can i determine, what is causing this load?
 
  • Like
Reactions: biztrHD
Did you update the Samsung 980 PRO firmware? There was an issue that would wear out the drives very quickly due to broken wear leveling.
It is well known that Proxmox writes a lot in logs and data for graphs. It runs fine from an old HDD but it can eat consumer SSDs (like yours), especially when write amplification is big.
 
  • Like
Reactions: Kingneutron
Did you update the Samsung 980 PRO firmware? There was an issue that would wear out the drives very quickly due to broken wear leveling.
It is well known that Proxmox writes a lot in logs and data for graphs. It runs fine from an old HDD but it can eat consumer SSDs (like yours), especially when write amplification is big.
Hi,

I was just reading up on that, but i seems like i am running on the correct firmware - based on this article it was fixed in the firmware (5V2QGXA7) that i am using:
https://nascompares.com/2023/02/15/...:text=This table was last updated on 15-02-23
1704268906933.png


Proxmox itself is installed on the Samsung 850 Pro disk - so i am assuming, that it wont be using the 980 Pro for logs and such?
 
I was just reading up on that, but i seems like i am running on the correct firmware - based on this article it was fixed in the firmware (5V2QGXA7) that i am using:
https://nascompares.com/2023/02/15/failing-samsung-980-and-990-ssds-latest-update-offical-response-more/#:~:text=This table was last updated on 15-02-23
I'm glad you don't have that issue.
Proxmox itself is installed on the Samsung 850 Pro disk - so i am assuming, that it wont be using the 980 Pro for logs and such?
Ah right, yes, I missed that and you are correct. Then it has to be VM/CT writes and amplification. People have reported wear to go up quickly early on and then stay "stable" for a long time. Do you trim the drive weekly (or so) and have enabled discard on virtual disks (and trim them inside the VMs)? Maybe start worrying when it's at 10%?
 
  • Like
Reactions: biztrHD
I'm glad you don't have that issue.

Ah right, yes, I missed that and you are correct. Then it has to be VM/CT writes and amplification. People have reported wear to go up quickly early on and then stay "stable" for a long time. Do you trim the drive weekly (or so) and have enabled discard on virtual disks (and trim them inside the VMs)? Maybe start worrying when it's at 10%?
Thanks for the reply :)

When i said i have enabled discard, this is what i meant:
1704269730385.png

Its enabled on the VMs on Proxmox level - i have not enabled any discard function inside the guest OS of the VMs.
But even if so, that only discards (nulls) the data that have deleted inside the VMs, and that is very little!

I have not touched the trim functionality, so i can not really say how often that is running :(

I could wait and see when it reaches 10%, but based on my previous experience with ESXi and Hyper-V, this seems very weird
 
  • Like
Reactions: biztrHD
You may want to have a try (and compare) with pmxcfs-ram tool, yes it is UN-official. If there was an official support for homelab hw, it would be part of some tunables in a config, but it is not, so here it is: https://github.com/isasmendiagus/pmxcfs-ram

EDIT: Disregard, also I have only noticed the 850 Pro note at the bottom. Leaving it here for others that get the problem on the PVE root.
 
Last edited:
  • Like
Reactions: biztrHD and ligistx
Windows VM ?
what disk defrag/optimize(=trim) show as last run ?
Its a mix - but i would say 70% Linux, and 30% Windows VMs.

Do you want the last trim date from the Windows VMs, in general or ? Not sure i understand what you meant :)
 
You may want to have a try (and compare) with pmxcfs-ram tool, yes it is UN-official. If there was an official support for homelab hw, it would be part of some tunables in a config, but it is not, so here it is: https://github.com/isasmendiagus/pmxcfs-ram

EDIT: Disregard, also I have only noticed the 850 Pro note at the bottom. Leaving it here for others that get the problem on the PVE root.
Thanks for point this handy little script out. Pretty straight forward, hopefully it helps save my SSD’s as I am seeing insane wear. I am seeing on the order of 20-30TB written per day according to what SMART is reporting. Absolutely nuts.
 
  • Like
Reactions: biztrHD
I am seeing on the order of 20-30TB written per day according to what SMART is reporting. Absolutely nuts.
Then you either write a lot of stuff or something is badly configured. I would check the journal with journald, check the storage config (like that you are not using ashift=9 with 4K sector disks) and analyse with iotop and iostat what is causing those writes.
 
Then you either write a lot of stuff or something is badly configured. I would check the journal with journald, check the storage config (like that you are not using ashift=9 with 4K sector disks) and analyse with iotop and iostat what is causing those writes.
How do I go about checking those things? I know enough to be dangerous, but not sure how to investigate those recommendations.
 
install iotop & sysstat: apt update && apt install iotop sysstat
iotop -a should show you what processes cause most IO.
iostat 900 2 will take 15 Minutes to finish and show you what disk and what virtual disk causes how much IO and written data.

For checking if something is badly configured, that is a rabbit hole. There is no easy way to check this without diving deep into your setup and checking lots of config files and so on.
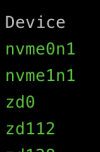
How do I corelate the virtual disks to VM's when I run iostat? I am seeing lots of zd's, I assume those are zpools, one for each disk? Or maybe datasets? I know ZFS at a pretty basic level, but not sure how to figure out what VM goes to what "zd":

A few of them:
1712118002019.png

Based on iotop, it looks like it smy pfsense VM which makes sense, I bet its writting LOTS of logs. But I need to coorelate that with iostat to be sure.
 
Last edited:
  • Like
Reactions: biztrHD
I am seeing on the order of 20-30TB written per day according to what SMART is reporting.
I was scratching my head with this post/thread, working out how any of this is even possible - until I discovered - you are not the OP, and you do run ZFS!

We know nothing about your HW/SW setup - which will definitely make a huge difference. Anyway ZFS is a whole different Disk Cruncher, not sure if anything is even not right.

A separate thread would have been helpful.
 
Last edited:
How do I corelate the virtual disks to VM's when I run iostat?
Use find /dev/zvol -type l -print -exec readlink {} \; for all zvols or udevadm info /dev/zdXXX | grep DEVLINKS for a specific one.
This will point you to the zvol and the zvol got the VMID in the name, so you can see which VM that zvol belongs to.

I am seeing lots of zd's, I assume those are zpools, one for each disk?
Those are your zvols, so one for each virtual disk of VMs on your ZFS pools.
Iostat won't show you LXCs or datasets as these use filesystems and not block devices.

Based on iotop, it looks like it smy pfsense VM which makes sense, I bet its writting LOTS of logs. But I need to coorelate that with iostat to be sure.
Make sure you installed pfsense using UFS and and not as ZFS as ZFS got massive overhead and running ZFS on ZFS will exponentially increase the write amplification. There is also an option in the OPNsense webUI to store logs on a tmpfs, so logs will only be written to RAM and won't hit your disks. I would guess pfsense got a similar option.
 
Last edited:
I was scratching my head with this post/thread, working out how any of this is even possible - until I discovered - you are not the OP, and you do run ZFS!

We now nothing about your HW/SW setup - which will definitely make a huge difference. Anyway ZFS is a whole different Disk Cruncher, not sure if anything is even not right.

A separate thread would have been helpful.
https://forum.proxmox.com/threads/pve-8-1-excessive-writes-to-boot-ssd.144201/

I only posted here as a response to the nifty little script that puts proxmox logs in RAM.

Use find /dev/zvol -type l -print -exec readlink {} \; for all zvols or udevadm info /dev/zdXXX | grep DEVLINKS for a specific one.
This will point you to the zvol and the zvol got the VMID in the name, so you can see which VM that zvol belongs to.


Those are your zvols, so one for each virtual disk of VMs on your ZFS pools.
Iostat won't show you LXCs or datasets as these use filesystems and not block devices.


Make sure you installed pfsense using UFS and and not as ZFS as ZFS got massive overhead and running ZFS on ZFS will exponentially increase the write amplification. There is also an option in the OPNsense webUI to store logs on a tmpfs, so logs will only be written to RAM and won't hit your disks. I would guess pfsense got a similar option.
I have it installed as ZFS… which is not helping anything. I didn’t realize the drastic amount of write amplification this would cause.

I did end up turning some additional packages specifically installed just for logging off, and that reduced my writes by a full order of magnitude, but I am not seeing how to write logs to RAM in pfsense itself. I will need to investigate that further. Documentation makes it sound like there is an option to check, but I am not seeing what option it is.
 
Thanks, I got it working yesterday. Seemingly borked pfblocker the first time, but it’s all fixed now. Pfsense was the main culprit, I got my total writes down from about 10MB/s to just under 1, huge decrease. Also used the proxmox script to put proxmox logs in RAM as well. So both of those account for that drop.
 
Thanks, I got it working yesterday. Seemingly borked pfblocker the first time, but it’s all fixed now. Pfsense was the main culprit, I got my total writes down from about 10MB/s to just under 1, huge decrease. Also used the proxmox script to put proxmox logs in RAM as well. So both of those account for that drop.


Google translate:

Hello. I have the same problem. Did you keep proxmox on zfs or reinstall proxmox on ufs?

How did you set Disk Settings? Can you post a screenshot of the settings?
 

About

The Proxmox community has been around for many years and offers help and support for Proxmox VE, Proxmox Backup Server, and Proxmox Mail Gateway.
We think our community is one of the best thanks to people like you!

Get your subscription!

The Proxmox team works very hard to make sure you are running the best software and getting stable updates and security enhancements, as well as quick enterprise support. Tens of thousands of happy customers have a Proxmox subscription. Get yours easily in our online shop.

Buy now!