e1000e eno1: Detected Hardware Unit Hang:

bogo22

Well-Known Member
Nov 4, 2016
54
6
48
Hello,

i am using Proxmox on an Intel NUC NUC8i3BEH2.
Actually it is running quite stable for a long time, but recently there is some more persistent network throuput (5-10 mb/s for several hours) on an Qemu vm and I get the following message from time to time "Detected Hardware Unit Hang" (see dmesg output). When I reboot the system it works for maybe 1-2 hours and than (after the persistent network throughput) I got the message again. I also tried ethtool -K eno1 tso off gso off but the hang still appears.
I got some lxc containers which are connected directly with bridge vmbr0 and some Qemu VM's which are all using VirtIO

How can I fix the problem? Thanks for your help.


pveversion -v
proxmox-ve: 6.0-2 (running kernel: 5.0.21-3-pve)
pve-manager: 6.0-9 (running version: 6.0-9/508dcee0)
pve-kernel-5.0: 6.0-9
pve-kernel-helper: 6.0-9
pve-kernel-4.15: 5.4-6
pve-kernel-5.0.21-3-pve: 5.0.21-7
pve-kernel-5.0.18-1-pve: 5.0.18-3
pve-kernel-5.0.15-1-pve: 5.0.15-1
pve-kernel-4.15.18-18-pve: 4.15.18-44
pve-kernel-4.15.18-14-pve: 4.15.18-39
pve-kernel-4.15.18-12-pve: 4.15.18-36
ceph-fuse: 12.2.11+dfsg1-2.1+b1
corosync: 3.0.2-pve4
criu: 3.11-3
glusterfs-client: 5.5-3
ksm-control-daemon: 1.3-1
libjs-extjs: 6.0.1-10
libknet1: 1.13-pve1
libpve-access-control: 6.0-2
libpve-apiclient-perl: 3.0-2
libpve-common-perl: 6.0-5
libpve-guest-common-perl: 3.0-1
libpve-http-server-perl: 3.0-3
libpve-storage-perl: 6.0-9
libqb0: 1.0.5-1
lvm2: 2.03.02-pve3
lxc-pve: 3.1.0-65
lxcfs: 3.0.3-pve60
novnc-pve: 1.1.0-1
proxmox-mini-journalreader: 1.1-1
proxmox-widget-toolkit: 2.0-8
pve-cluster: 6.0-7
pve-container: 3.0-7
pve-docs: 6.0-7
pve-edk2-firmware: 2.20190614-1
pve-firewall: 4.0-7
pve-firmware: 3.0-2
pve-ha-manager: 3.0-2
pve-i18n: 2.0-3
pve-qemu-kvm: 4.0.1-3
pve-xtermjs: 3.13.2-1
qemu-server: 6.0-9
smartmontools: 7.0-pve2
spiceterm: 3.1-1
vncterm: 1.6-1
zfsutils-linux: 0.8.2-pve1

cat /etc/network/interfaces
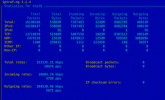
auto lo
iface lo inet loopback

iface eno1 inet manual

auto vmbr0
iface vmbr0 inet static
address 192.168.2.12
netmask 255.255.255.0
gateway 192.168.2.1
bridge_ports eno1
bridge_stp off
bridge_fd 0

ethtool -k eno1
Features for eno1:
rx-checksumming: on
tx-checksumming: on
tx-checksum-ipv4: off [fixed]
tx-checksum-ip-generic: on
tx-checksum-ipv6: off [fixed]
tx-checksum-fcoe-crc: off [fixed]
tx-checksum-sctp: off [fixed]
scatter-gather: on
tx-scatter-gather: on
tx-scatter-gather-fraglist: off [fixed]
tcp-segmentation-offload: off
tx-tcp-segmentation: off
tx-tcp-ecn-segmentation: off [fixed]
tx-tcp-mangleid-segmentation: off
tx-tcp6-segmentation: off
udp-fragmentation-offload: off
generic-segmentation-offload: off
generic-receive-offload: on
large-receive-offload: off [fixed]
rx-vlan-offload: on
tx-vlan-offload: on
ntuple-filters: off [fixed]
receive-hashing: on
highdma: on [fixed]
rx-vlan-filter: off [fixed]
vlan-challenged: off [fixed]
tx-lockless: off [fixed]
netns-local: off [fixed]
tx-gso-robust: off [fixed]
tx-fcoe-segmentation: off [fixed]
tx-gre-segmentation: off [fixed]
tx-gre-csum-segmentation: off [fixed]
tx-ipxip4-segmentation: off [fixed]
tx-ipxip6-segmentation: off [fixed]
tx-udp_tnl-segmentation: off [fixed]
tx-udp_tnl-csum-segmentation: off [fixed]
tx-gso-partial: off [fixed]
tx-sctp-segmentation: off [fixed]
tx-esp-segmentation: off [fixed]
tx-udp-segmentation: off [fixed]
fcoe-mtu: off [fixed]
tx-nocache-copy: off
loopback: off [fixed]
rx-fcs: off
rx-all: off
tx-vlan-stag-hw-insert: off [fixed]
rx-vlan-stag-hw-parse: off [fixed]
rx-vlan-stag-filter: off [fixed]
l2-fwd-offload: off [fixed]
hw-tc-offload: off [fixed]
esp-hw-offload: off [fixed]
esp-tx-csum-hw-offload: off [fixed]
rx-udp_tunnel-port-offload: off [fixed]
tls-hw-tx-offload: off [fixed]
tls-hw-rx-offload: off [fixed]
rx-gro-hw: off [fixed]
tls-hw-record: off [fixed]


dmesg | grep e1000e
Bash:
[    2.605546] e1000e: Intel(R) PRO/1000 Network Driver - 3.2.6-k
[    2.605547] e1000e: Copyright(c) 1999 - 2015 Intel Corporation.
[    2.606144] e1000e 0000:00:1f.6: Interrupt Throttling Rate (ints/sec) set to dynamic conservative mode
[    3.009976] e1000e 0000:00:1f.6 0000:00:1f.6 (uninitialized): registered PHC clock
[    3.078037] e1000e 0000:00:1f.6 eth0: (PCI Express:2.5GT/s:Width x1) 94:c6:91:a4:ec:d2
[    3.078039] e1000e 0000:00:1f.6 eth0: Intel(R) PRO/1000 Network Connection
[    3.078127] e1000e 0000:00:1f.6 eth0: MAC: 13, PHY: 12, PBA No: FFFFFF-0FF
[    3.078831] e1000e 0000:00:1f.6 eno1: renamed from eth0
[   12.376548] e1000e: eno1 NIC Link is Up 1000 Mbps Full Duplex, Flow Control: None

dmesg error output (see quote below or for full output pastebin):
Bash:
[72589.451401] vmbr0: port 2(veth900i0) entered blocking state
[72589.451402] vmbr0: port 2(veth900i0) entered disabled state
[72589.451451] device veth900i0 entered promiscuous mode
[72589.856974] eth0: renamed from vethHS0XH5
[72590.410454] IPv6: ADDRCONF(NETDEV_CHANGE): eth0: link becomes ready
[72590.410483] vmbr0: port 2(veth900i0) entered blocking state
[72590.410484] vmbr0: port 2(veth900i0) entered forwarding state
[86023.359460] hrtimer: interrupt took 23694 ns
[97377.240263] e1000e 0000:00:1f.6 eno1: Detected Hardware Unit Hang:
                 TDH                  <22>
                 TDT                  <2f>
                 next_to_use          <2f>
                 next_to_clean        <21>
               buffer_info[next_to_clean]:
                 time_stamp           <101725292>
                 next_to_watch        <22>
                 jiffies              <1017253e0>
                 next_to_watch.status <0>
               MAC Status             <40080083>
               PHY Status             <796d>
               PHY 1000BASE-T Status  <3800>
               PHY Extended Status    <3000>
               PCI Status             <10>
[97381.276165] e1000e 0000:00:1f.6 eno1: Detected Hardware Unit Hang:
                 TDH                  <22>
                 TDT                  <2f>
                 next_to_use          <2f>
                 next_to_clean        <21>
               buffer_info[next_to_clean]:
                 time_stamp           <101725292>
                 next_to_watch        <22>
                 jiffies              <1017257d1>
                 next_to_watch.status <0>
               MAC Status             <40080083>
               PHY Status             <796d>
               PHY 1000BASE-T Status  <3800>
               PHY Extended Status    <3000>
               PCI Status             <10>
[121439.796191] e1000e 0000:00:1f.6 eno1: Detected Hardware Unit Hang:
                  TDH                  <4>
                  TDT                  <9a>
                  next_to_use          <9a>
                  next_to_clean        <3>
                buffer_info[next_to_clean]:
                  time_stamp           <101ce1456>
                  next_to_watch        <4>
                  jiffies              <101ce1ee0>
                  next_to_watch.status <0>
                MAC Status             <40080083>
                PHY Status             <796d>
                PHY 1000BASE-T Status  <3800>
                PHY Extended Status    <3000>
                PCI Status             <10>
[121440.692004] e1000e 0000:00:1f.6 eno1: Reset adapter unexpectedly
[121440.692068] vmbr0: port 1(eno1) entered disabled state
[121445.846522] e1000e: eno1 NIC Link is Up 1000 Mbps Full Duplex, Flow Control: None
[121445.846594] vmbr0: port 1(eno1) entered blocking state
[121445.846597] vmbr0: port 1(eno1) entered forwarding state
[123496.079024] e1000e 0000:00:1f.6 eno1: Detected Hardware Unit Hang:
                  TDH                  <44>
                  TDT                  <9b>
                  next_to_use          <9b>
                  next_to_clean        <43>
                buffer_info[next_to_clean]:
                  time_stamp           <101d5f5e3>
                  next_to_watch        <44>
                  jiffies              <101d5f700>
                  next_to_watch.status <0>
                MAC Status             <40080083>
                PHY Status             <796d>
                PHY 1000BASE-T Status  <3800>
                PHY Extended Status    <3000>
                PCI Status             <10>
[124251.524535] e1000e 0000:00:1f.6 eno1: Reset adapter unexpectedly
[124251.524619] vmbr0: port 1(eno1) entered disabled state
[124256.099190] e1000e: eno1 NIC Link is Up 1000 Mbps Full Duplex, Flow Control: None
[124256.099270] vmbr0: port 1(eno1) entered blocking state
[124256.099276] vmbr0: port 1(eno1) entered forwarding state
 
Last edited:
  • Like
Reactions: semanticbeeng
@bogo22

I am seeing the same errors too now:

Code:
Sep 09 14:46:40 pve pvestatd[1206]: storage 'ISOs-SMB' is not online
Sep 09 14:46:42 pve kernel: e1000e 0000:00:1f.6 eno1: Detected Hardware Unit Hang:
                              TDH                  <ab>
                              TDT                  <e4>
                              next_to_use          <e4>
                              next_to_clean        <aa>
                            buffer_info[next_to_clean]:
                              time_stamp           <10010824a>
                              next_to_watch        <ab>
                              jiffies              <100108a20>
                              next_to_watch.status <0>
                            MAC Status             <40080083>
                            PHY Status             <796d>
                            PHY 1000BASE-T Status  <3800>
                            PHY Extended Status    <3000>
                            PCI Status             <10>
Sep 09 14:46:42 pve kernel: e1000e 0000:00:1f.6 eno1: Reset adapter unexpectedly

How did you fix it ?
Thx
 
ethtool -K eth0 tx off rx off

Disabling TCP checksum offloading worked for me

I wonder how do I know if my tx/rx on or off?

I see:

root@pve:~# ethtool -g eno1
Ring parameters for eno1:
Pre-set maximums:
RX: 4096
RX Mini: 0
RX Jumbo: 0
TX: 4096
Current hardware settings:
RX: 256
RX Mini: 0
RX Jumbo: 0
TX: 256

In other words, if i set it as ethtool -K eth0 tx off rx off, how do I unset it in case if needed?

Thx


# ethtool -a eth0
Pause parameters for eth0:
Autonegotiate: on
RX: on
TX: on
 
  • Like
Reactions: chudak
# ethtool -a eth0
Pause parameters for eth0:
Autonegotiate: on
RX: on
TX: on

Spoke too fast ...
I was uploading ~10GB with multi threads and still hit the error:

Code:
Apr 07 14:21:21 pve kernel: e1000e 0000:00:1f.6 eno1: Detected Hardware Unit Hang:
                              TDH                  <f3>
                              TDT                  <16>
                              next_to_use          <16>
                              next_to_clean        <f2>
                            buffer_info[next_to_clean]
                              time_stamp           <101a193f4>
                              next_to_watch        <f3>
                              jiffies              <101a19518>
                              next_to_watch.status <0>
                            MAC Status             <40080083>
                            PHY Status             <796d>
                            PHY 1000BASE-T Status  <3800>
                            PHY Extended Status    <3000>
                            PCI Status             <10>
Apr 07 14:21:23 pve kernel: e1000e 0000:00:1f.6 eno1: Detected Hardware Unit Hang:
                              TDH                  <f3>
                              TDT                  <16>
                              next_to_use          <16>
                              next_to_clean        <f2>
                            buffer_info[next_to_clean]
                              time_stamp           <101a193f4>
                              next_to_watch        <f3>
                              jiffies              <101a19710>
                              next_to_watch.status <0>
                            MAC Status             <40080083>
                            PHY Status             <796d>
                            PHY 1000BASE-T Status  <3800>
                            PHY Extended Status    <3000>
                            PCI Status             <10>
Apr 07 14:21:25 pve kernel: e1000e 0000:00:1f.6 eno1: Detected Hardware Unit Hang:
                              TDH                  <f3>
                              TDT                  <16>
                              next_to_use          <16>
                              next_to_clean        <f2>
                            buffer_info[next_to_clean]
                              time_stamp           <101a193f4>
                              next_to_watch        <f3>
                              jiffies              <101a19900>
                              next_to_watch.status <0>
                            MAC Status             <40080083>
                            PHY Status             <796d>
                            PHY 1000BASE-T Status  <3800>
                            PHY Extended Status    <3000>
                            PCI Status             <10>
Apr 07 14:21:27 pve kernel: e1000e 0000:00:1f.6 eno1: Detected Hardware Unit Hang:
                              TDH                  <f3>
                              TDT                  <16>
                              next_to_use          <16>
                              next_to_clean        <f2>
                            buffer_info[next_to_clean]
                              time_stamp           <101a193f4>
                              next_to_watch        <f3>
                              jiffies              <101a19af8>
                              next_to_watch.status <0>
                            MAC Status             <40080083>
                            PHY Status             <796d>
                            PHY 1000BASE-T Status  <3800>
                            PHY Extended Status    <3000>
                            PCI Status             <10>
Apr 07 14:21:29 pve kernel: e1000e 0000:00:1f.6 eno1: Detected Hardware Unit Hang:
                              TDH                  <f3>
                              TDT                  <16>
                              next_to_use          <16>
                              next_to_clean        <f2>
                            buffer_info[next_to_clean]
                              time_stamp           <101a193f4>
                              next_to_watch        <f3>
                              jiffies              <101a19ce8>
                              next_to_watch.status <0>
                            MAC Status             <40080083>
                            PHY Status             <796d>
                            PHY 1000BASE-T Status  <3800>
                            PHY Extended Status    <3000>
                            PCI Status             <10>
Apr 07 14:21:29 pve kernel: e1000e 0000:00:1f.6 eno1: Reset adapter unexpectedly

However, the VM was not hung and unresponsive,which is also a better behavior
 
  • Like
Reactions: semanticbeeng
chudak,
When did this problem start for you? I have a proxmox secondary node, PVE2, running on an Asus board with the Intel Pro/1000 and it just recently , last two months, started behaving like this.
[ 1902.246655] e1000e 0000:00:19.0 eno1: Detected Hardware Unit Hang: TDH <bd> TDT <e5> next_to_use <e5> next_to_clean <bc> buffer_info[next_to_clean]: time_stamp <100061a8f> next_to_watch <bd> jiffies <100061c48> next_to_watch.status <0> MAC Status <80083> PHY Status <796d> PHY 1000BASE-T Status <3c00> PHY Extended Status <3000> PCI Status <10>

Virtual machine is accessed across a 1gb network from the primary proxmox node named PVE. I guess I need to go back through old logs to see if I can spot when the problem started.
 
Today I'v failed in issue with some of the latest version of proxmox:

Bash:
Mar  8 10:19:08 ox1 kernel: [7660556.021229] e1000e 0000:00:1f.6 enp0s31f6: Reset adapter unexpectedly
Mar  8 10:19:12 ox1 kernel: [7660559.987660] e1000e 0000:00:1f.6 enp0s31f6: NIC Link is Up 1000 Mbps Full Duplex, Flow Control: Rx/Tx
Mar  8 10:19:14 ox1 kernel: [7660561.910802] e1000e 0000:00:1f.6 enp0s31f6: Detected Hardware Unit Hang:
Mar  8 10:19:14 ox1 kernel: [7660561.910802]   TDH                  <0>
Mar  8 10:19:14 ox1 kernel: [7660561.910802]   TDT                  <1>
Mar  8 10:19:14 ox1 kernel: [7660561.910802]   next_to_use          <1>
Mar  8 10:19:14 ox1 kernel: [7660561.910802]   next_to_clean        <0>
Mar  8 10:19:14 ox1 kernel: [7660561.910802] buffer_info[next_to_clean]:
Mar  8 10:19:14 ox1 kernel: [7660561.910802]   time_stamp           <17225a522>
Mar  8 10:19:14 ox1 kernel: [7660561.910802]   next_to_watch        <0>
Mar  8 10:19:14 ox1 kernel: [7660561.910802]   jiffies              <17225a700>
Mar  8 10:19:14 ox1 kernel: [7660561.910802]   next_to_watch.status <0>
Mar  8 10:19:14 ox1 kernel: [7660561.910802] MAC Status             <80083>
Mar  8 10:19:14 ox1 kernel: [7660561.910802] PHY Status             <796d>
Mar  8 10:19:14 ox1 kernel: [7660561.910802] PHY 1000BASE-T Status  <7800>
Mar  8 10:19:14 ox1 kernel: [7660561.910802] PHY Extended Status    <3000>
Mar  8 10:19:14 ox1 kernel: [7660561.910802] PCI Status             <10>

when server became unavailable

00:1f.6 Ethernet controller: Intel Corporation Ethernet Connection (2) I219-LM (rev 31)
01:00.0 RAID bus controller: Adaptec Series 8 12G SAS/PCIe 3 (rev 01)
02:00.0 Ethernet controller: Intel Corporation 82574L Gigabit Network Connection
 
Last edited:
  • Like
Reactions: elriti
Same here, on a Lenovo M720q:

syslog output:

Bash:
May 22 19:22:49 basestar kernel: [186242.857338] e1000e 0000:00:1f.6 eno1: Detected Hardware Unit Hang:
May 22 19:22:49 basestar kernel: [186242.857338]   TDH                  <79>
May 22 19:22:49 basestar kernel: [186242.857338]   TDT                  <a1>
May 22 19:22:49 basestar kernel: [186242.857338]   next_to_use          <a1>
May 22 19:22:49 basestar kernel: [186242.857338]   next_to_clean        <78>
May 22 19:22:49 basestar kernel: [186242.857338] buffer_info[next_to_clean]:
May 22 19:22:49 basestar kernel: [186242.857338]   time_stamp           <102c54e19>
May 22 19:22:49 basestar kernel: [186242.857338]   next_to_watch        <79>
May 22 19:22:49 basestar kernel: [186242.857338]   jiffies              <102c555a8>
May 22 19:22:49 basestar kernel: [186242.857338]   next_to_watch.status <0>
May 22 19:22:49 basestar kernel: [186242.857338] MAC Status             <40080083>
May 22 19:22:49 basestar kernel: [186242.857338] PHY Status             <796d>
May 22 19:22:49 basestar kernel: [186242.857338] PHY 1000BASE-T Status  <3c00>
May 22 19:22:49 basestar kernel: [186242.857338] PHY Extended Status    <3000>
May 22 19:22:49 basestar kernel: [186242.857338] PCI Status             <10>
May 22 19:22:49 basestar kernel: [186242.953122] e1000e 0000:00:1f.6 eno1: Reset adapter unexpectedly
May 22 19:22:49 basestar kernel: [186243.043502] vmbr0: port 1(eno1) entered disabled state
May 22 19:22:53 basestar kernel: [186246.739797] e1000e 0000:00:1f.6 eno1: NIC Link is Up 1000 Mbps Full Duplex, Flow Control: None
May 22 19:22:53 basestar kernel: [186246.739854] vmbr0: port 1(eno1) entered blocking state
May 22 19:22:53 basestar kernel: [186246.739858] vmbr0: port 1(eno1) entered forwarding state


lspci:
Code:
00:1f.6 Ethernet controller: Intel Corporation Ethernet Connection (7) I219-V (rev 10)
    DeviceName: Onboard - Ethernet
    Subsystem: Lenovo Ethernet Connection (7) I219-V
    Kernel driver in use: e1000e
    Kernel modules: e1000e
 
For me its super weird because I have 2 identical Nucs, same model: 10th Gen i7 same Intel Nic. (Intel NUC10FNH)
One has this problems and can only be fixed if I disabled the tso, gso and gro, I installed the permanent fix in the /etc/network/interfaces file and see if this will help permanently.
The other one works normally (besides the fact that it reaches 90 Degress sometimes).
Why sometimes this happens on some identitcal devices?
Same PVE Version, same BIOS, same Network same everything. Its Identical.
 
Why sometimes this happens on some identitcal devices?
This is a known bug with I219-V,I218-V,... nic model since years.
Almost all bug report are coming from NUC users (just check on the forum).
I think that it's simply because they are cheap card, and they can handle the offloadling load too much.
 
For me its super weird because I have 2 identical Nucs, same model: 10th Gen i7 same Intel Nic. (Intel NUC10FNH)
One has this problems and can only be fixed if I disabled the tso, gso and gro, I installed the permanent fix in the /etc/network/interfaces file and see if this will help permanently.
The other one works normally (besides the fact that it reaches 90 Degress sometimes).
Why sometimes this happens on some identitcal devices?
Same PVE Version, same BIOS, same Network same everything. Its Identical.
I have earlier Intel NIC affected by the same issue. I found I only needed to disable offload when I'd configured vlans on the interface. Traffic volume didn't appear to be a factor.
 

About

The Proxmox community has been around for many years and offers help and support for Proxmox VE, Proxmox Backup Server, and Proxmox Mail Gateway.
We think our community is one of the best thanks to people like you!

Get your subscription!

The Proxmox team works very hard to make sure you are running the best software and getting stable updates and security enhancements, as well as quick enterprise support. Tens of thousands of happy customers have a Proxmox subscription. Get yours easily in our online shop.

Buy now!