Hello!
I use modest hardware for my Proxmox VE v8.4.1 server: 8 GB RAM, CPU AMD A4-5000.
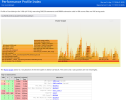
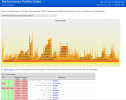
2 containers and 1 VM are running fine, no issues with performance. A lot of free RAM, load average is about 0.1-0.2:
CLI and web UI works pretty fast.
But, by some reason, commands
Comparison (made by GNU
I checked
I've installed package
But I don't know what to do next")
I can share
P.S.: I hope this post maybe helpful for other users in future, how to troubleshoot such issues.
I use modest hardware for my Proxmox VE v8.4.1 server: 8 GB RAM, CPU AMD A4-5000.
2 containers and 1 VM are running fine, no issues with performance. A lot of free RAM, load average is about 0.1-0.2:
Code:
alexey@pve03 ~ % free -mw
               total        used        free      shared     buffers       cache   available
Mem:            7367        1517        3471         202         419        2468        5849
Swap:           1023           3        1020
alexey@pve03 ~ % uptime
 20:54:04 up 8 days, 19:31,  2 users,  load average: 0.16, 0.20, 0.23
CLI and web UI works pretty fast.
But, by some reason, commands
pct and qm are running very slow, probably they have some delay somewhere internally.Comparison (made by GNU
time):- Command
sudo lxc-ls --fancytakes 0.054 seconds, - command
sudo pct listtakes 4.041 seconds, - command
sudo qm list --fulltakes 3.860 seconds, - command
sudo pct exec 100 -- whoamitakes 3.843 seconds.
strace, but its output doesn't give me a glue:
Code:
alexey@pve03 ~ % sudo strace -c pct list
VMID       Status     Lock         Name
100        running                 name1
101        running                 name2
% time     seconds  usecs/call     calls    errors syscall
------ ----------- ----------- --------- --------- ------------------
 30.75    0.052924       13231         4           wait4
 19.10    0.032878           6      5048      4391 newfstatat
 19.02    0.032743        8185         4           clone
  7.44    0.012798          24       529           mmap
  5.82    0.010014           6      1451           read
  4.82    0.008298          13       633        53 openat
  2.35    0.004053           5       723        35 lseek
  2.10    0.003612           4       855           brk
  1.97    0.003387           5       607           close
  1.91    0.003286           7       465       462 ioctl
  1.08    0.001853          15       122           mprotect
  0.41    0.000706           7        92           rt_sigaction
  0.30    0.000519           9        54           rt_sigprocmask
  0.29    0.000502           3       153           getegid
  0.29    0.000497           3       153           getgid
  0.29    0.000494           2       165           geteuid
  0.28    0.000479           3       153           getuid
  0.26    0.000455          26        17           munmap
  0.24    0.000421           9        44           fcntl
  0.21    0.000363          18        20           sendto
  0.13    0.000223          22        10           pipe2
  0.11    0.000185          15        12           recvfrom
  0.10    0.000179          25         7           connect
  0.09    0.000157           9        16           setitimer
  0.08    0.000146           8        18           getpid
  0.06    0.000104           4        24         2 futex
  0.06    0.000102          10        10        10 mkdir
  0.06    0.000101          12         8           socket
  0.04    0.000077          38         2           readlink
  0.04    0.000073          73         1           inotify_init
  0.04    0.000071           8         8           setsockopt
  0.03    0.000051          12         4           pselect6
  0.03    0.000048          12         4           rt_sigreturn
  0.03    0.000044           4        10         4 prctl
  0.02    0.000043          21         2           pread64
  0.02    0.000042           7         6           fallocate
  0.02    0.000031          15         2           membarrier
  0.01    0.000025          12         2           kill
  0.01    0.000019           4         4           inotify_add_watch
  0.01    0.000018           3         6           ftruncate
  0.01    0.000014           4         3           write
  0.01    0.000011          11         1           mremap
  0.01    0.000011          11         1           arch_prctl
  0.01    0.000009           9         1           set_tid_address
  0.01    0.000009           9         1           set_robust_list
  0.01    0.000009           9         1           rseq
  0.00    0.000006           6         1           recvmsg
  0.00    0.000005           1         3           uname
  0.00    0.000005           0         6           getrandom
  0.00    0.000003           3         1           getresuid
  0.00    0.000003           1         2           prlimit64
  0.00    0.000002           2         1           getresgid
  0.00    0.000000           0         1           poll
  0.00    0.000000           0         2         2 access
  0.00    0.000000           0         1           execve
  0.00    0.000000           0         1           sysinfo
  0.00    0.000000           0         2         2 statfs
  0.00    0.000000           0         1           fstatfs
------ ----------- ----------- --------- --------- ------------------
100.00    0.172108          14     11478      4961 total
Code:
alexey@pve03 ~ % sudo strace -c qm list
      VMID NAME                 STATUS     MEM(MB)    BOOTDISK(GB) PID
       102 name3                stopped    512                8.00 0
% time     seconds  usecs/call     calls    errors syscall
------ ----------- ----------- --------- --------- ------------------
 38.09    0.032436           6      5074      4424 newfstatat
 16.02    0.013637          25       545           mmap
 10.83    0.009220           6      1419           read
 10.01    0.008525          13       626        53 openat
  4.12    0.003505           5       683         3 lseek
  3.61    0.003073           5       574           close
  3.48    0.002967           3       835           brk
  3.30    0.002806           6       421       418 ioctl
  2.74    0.002334          18       125           mprotect
  1.09    0.000930          12        73           rt_sigaction
  0.98    0.000832           4       168           geteuid
  0.95    0.000813           5       156           getgid
  0.94    0.000799           5       156           getuid
  0.91    0.000775           4       156           getegid
  0.81    0.000693         693         1           execve
  0.60    0.000515          27        19           munmap
  0.22    0.000189           7        26         3 futex
  0.17    0.000146          24         6           fallocate
  0.12    0.000099          16         6           ftruncate
  0.12    0.000098          49         2           readlink
  0.10    0.000089           6        14           getpid
  0.10    0.000085           8        10           fcntl
  0.09    0.000078           7        10        10 mkdir
  0.08    0.000072           9         8           sendto
  0.07    0.000057          28         2           socket
  0.04    0.000037          18         2           pread64
  0.04    0.000034          17         2           prlimit64
  0.04    0.000031          15         2           membarrier
  0.03    0.000027          13         2           write
  0.03    0.000025          12         2         2 access
  0.03    0.000024           8         3           uname
  0.02    0.000021           3         6           getrandom
  0.02    0.000019          19         1           rseq
  0.02    0.000018          18         1           arch_prctl
  0.02    0.000018          18         1           set_tid_address
  0.02    0.000017          17         1           getresgid
  0.02    0.000017          17         1           set_robust_list
  0.02    0.000016          16         1           getresuid
  0.02    0.000015           1        10         4 prctl
  0.02    0.000014           3         4           inotify_add_watch
  0.01    0.000010           1         6           rt_sigprocmask
  0.01    0.000007           7         1           recvmsg
  0.01    0.000007           3         2           getdents64
  0.01    0.000006           6         1           poll
  0.01    0.000006           6         1           connect
  0.00    0.000004           2         2           setsockopt
  0.00    0.000003           3         1           fstatfs
  0.00    0.000000           0         1           sysinfo
  0.00    0.000000           0         2         2 statfs
  0.00    0.000000           0         1           inotify_init
------ ----------- ----------- --------- --------- ------------------
100.00    0.085149           7     11172      4919 total
I checked
newfstatat calls with sudo strace -fy -e trace=newfstatat pct list 2>&1 | less, it looks mostly like this:
Code:
…
newfstatat(AT_FDCWD</tmp/1>, "/etc/perl/XML/LibXML.pmc", 0x7ffd8fef6d10, 0) = -1 ENOENT (No such file or directory)
newfstatat(AT_FDCWD</tmp/1>, "/etc/perl/XML/LibXML.pm", 0x7ffd8fef6d10, 0) = -1 ENOENT (No such file or directory)
newfstatat(AT_FDCWD</tmp/1>, "/usr/local/lib/x86_64-linux-gnu/perl/5.36.0/XML/LibXML.pmc", 0x7ffd8fef6d10, 0) = -1 ENOENT (No such file or directory)
newfstatat(AT_FDCWD</tmp/1>, "/usr/local/lib/x86_64-linux-gnu/perl/5.36.0/XML/LibXML.pm", 0x7ffd8fef6d10, 0) = -1 ENOENT (No such file or directory)
newfstatat(AT_FDCWD</tmp/1>, "/usr/local/share/perl/5.36.0/XML/LibXML.pmc", 0x7ffd8fef6d10, 0) = -1 ENOENT (No such file or directory)
newfstatat(AT_FDCWD</tmp/1>, "/usr/local/share/perl/5.36.0/XML/LibXML.pm", 0x7ffd8fef6d10, 0) = -1 ENOENT (No such file or directory)
newfstatat(AT_FDCWD</tmp/1>, "/usr/lib/x86_64-linux-gnu/perl5/5.36/XML/LibXML.pmc", 0x7ffd8fef6d10, 0) = -1 ENOENT (No such file or directory)
newfstatat(AT_FDCWD</tmp/1>, "/usr/lib/x86_64-linux-gnu/perl5/5.36/XML/LibXML.pm", {st_mode=S_IFREG|0644, st_size=66124, ...}, 0) = 0
…
I've installed package
libdevel-nytprof-perl and created nytprof.out files for pct list and qm list, then converted them into HTML:
Bash:
sudo perl -d:NYTProf /usr/sbin/qm list
nytprofhtml
But I don't know what to do next
I can share
nytprof.out files: it is 3.5 MB for qm and 12.5 MB for pct (there are 5 files, probably because of threads).P.S.: I hope this post maybe helpful for other users in future, how to troubleshoot such issues.