corosync: OOM killed after some days with 100%CPU, cluster nodes isolated ("Quorate")

Sep 13, 2022
121
40
33
Hi,

I have an almost idle test cluster with 12 nodes (pve-7.4). With an uptime of a year or so without issues, last week I noticed in web GUI, that only the local node information showed up. I logged in and saw on three randomly picked nodes that corosync had 100%CPU, apparently busy-loop over some network error; the log showed many "Retransmit List:" entries. Today I planned to take a look. The load is gone, as corosyncs have been out-of-memory-killed and nodes are "Flags: Quorate".
Code:
ansible all -m shell -a "systemctl status corosync.service" | grep Active

     Active: inactive (dead)
     Active: active (running) since Fri 2023-09-22 07:08:15 CEST; 1 years 3 months ago
     Active: failed (Result: oom-kill) since Thu 2025-01-16 18:02:25 CET; 3 days ago
     Active: active (running) since Mon 2023-08-14 19:45:28 CEST; 1 years 5 months ago
     Active: active (running) since Mon 2023-08-14 19:45:25 CEST; 1 years 5 months ago
     Active: failed (Result: oom-kill) since Thu 2025-01-16 16:04:09 CET; 3 days ago
     Active: failed (Result: oom-kill) since Thu 2025-01-16 17:56:14 CET; 3 days ago
     Active: active (running) since Thu 2025-01-16 16:15:10 CET; 3 days ago
     Active: failed (Result: oom-kill) since Thu 2025-01-16 17:47:49 CET; 3 days ago
     Active: active (running) since Fri 2023-09-22 07:08:23 CEST; 1 years 3 months ago
     Active: active (running) since Tue 2023-11-21 19:44:39 CET; 1 years 1 months ago
     Active: active (running) since Fri 2023-09-22 07:08:23 CEST; 1 years 3 months ago
     Active: active (running) since Fri 2023-09-22 07:08:08 CEST; 1 years 3 months ago
     Active: active (running) since Fri 2023-09-22 07:08:08 CEST; 1 years 3 months ago
I have no clue what now would be the best steps to continue.
I think I will start upgrading to latest PVE version and consider building corosync with debug symbols to be able to debug it, but I'm walking in the dark...
Any hints or recommendations?
 
well, the corosync logs might shed some light.. most of our packages come with matching -dbgsym counterparts btw, but I doubt debugging with gdb is the way to go here before taking an in-depth look at the logs..
 
Hi, thanks for your quick reply!
I see I even already installed corosync-dbgsym in 2023.
I think according to log issues start with corosync[1321]: [KNET ] link: host: 101 link: 0 is down for each node, but I think it could possibly because of the high load (because interactively testing with ping and alike, connections seem to be good). Maybe some temporary issue causes some error and as follow-up-error corosync gets 100% CPU. I think without fixing the 100% CPU issue possibly latency could be so big that the real cause could be invisible.

it is just a test cluster, so I leave it running in the hope it happens again and that I notice it, to be able to provide further details.
I was able to build corosync and libqb from sources, install and run it, let's see if it happens again.

Best regards

NB: sources suggest that root cause could be network issues, but flood ping is stable and SSH stays fast even then
Code:
root@l-101:~# ping -s 1500 -f l-102
PING l-102 (10.1.1.102) 1500(1528) bytes of data.
.^C
--- l-102 ping statistics ---
4423004 packets transmitted, 4423003 received, 2.26091e-05% packet loss, time 810948ms
rtt min/avg/max/mdev = 0.117/0.171/3.755/0.019 ms, pipe 2, ipg/ewma 0.183/0.181 ms
(IP and hostname symbolic)
 
Last edited:
it is possible that you are running into some old, already fixed bug.. note that corosync is very latency sensitive, links being marked down can also mean that they struggle to keep up or lose single packets. could you maybe describe the network setup/corosync configuration/cluster size?
 
  • Like
Reactions: sdettmer
it is possible that you are running into some old, already fixed bug..
Ahh that would be perfect, just installing updates and being done :)

But I think I updated everything:

Code:
pve-manager/8.3.3/f157a38b211595d6 (running kernel: 6.8.12-7-pve)

root@l-103:/home/sdettmer/work/corosync/corosync-pve# dpkg -l "coro*" libqb* *knet*
Desired=Unknown/Install/Remove/Purge/Hold
| Status=Not/Inst/Conf-files/Unpacked/halF-conf/Half-inst/trig-aWait/Trig-pend
|/ Err?=(none)/Reinst-required (Status,Err: uppercase=bad)
||/ Name                  Version      Architecture Description
+++-=====================-============-============-=============================================================
ii  corosync              3.1.7-pve3   amd64        cluster engine daemon and utilities
ii  corosync-dbgsym       3.1.7-pve3   amd64        debug symbols for corosync
ii  libknet1:amd64        1.28-pve1    amd64        kronosnet core switching implementation
ii  libqb-dev:amd64       2.0.3-1      amd64        high performance client server features library (devel files)
ii  libqb100:amd64        2.0.3-1      amd64        high performance client server features library
ii  libqb100-dbgsym:amd64 2.0.3-1      amd64        debug symbols for libqb100

NB: I build corosync and libqb from source but packages have same versions, so I hope its right.

note that corosync is very latency sensitive,
Yes, it is quite.... interesting. For example, they dynamically create new timers all the time and even cyclic calls are non-trivial to see by this. I did some interactive debugging (latency in range of minutes) and it did behave quite well!

Code:
Jan 22 13:00:48 l-103 corosync[41243]:   [KNET  ] host: host: 1 (passive) best link: 0 (pri: 1)
Jan 22 13:00:48 l-103 corosync[41243]:   [KNET  ] host: host: 1 has no active links
Jan 22 13:00:55 l-103 corosync[41243]:   [TOTEM ] Process pause detected for 6857 ms, flushing membership messages.
Jan 22 13:00:55 l-103 corosync[41243]:   [MAIN  ] Corosync main process was not scheduled (@1737547255253) for 16256.2598 ms (threshold is 7600.0000 ms). Consider token timeout increase.
Jan 22 13:00:58 l-103 corosync[41243]:   [KNET  ] link: Resetting MTU for link 0 because host 1 joined
Jan 22 13:00:58 l-103 corosync[41243]:   [KNET  ] link: Resetting MTU for link 0 because host 112 joined
Jan 22 13:03:11 l-103 corosync[41243]:   [MAIN  ] Corosync main process was not scheduled (@1737547391528) for 136274.9062 ms (threshold is 7600.0000 ms). Consider token timeout increase.
Jan 22 13:03:11 l-103 corosync[41243]:   [KNET  ] link: host: 112 link: 0 is down
Jan 22 13:03:11 l-103 corosync[41243]:   [KNET  ] link: host: 1 link: 0 is down
Jan 22 13:03:11 l-103 corosync[41243]:   [KNET  ] pmtud: Global data MTU changed to: 1397
Jan 22 13:03:11 l-103 corosync[41243]:   [KNET  ] host: host: 1 (passive) best link: 0 (pri: 1)
Jan 22 13:03:11 l-103 corosync[41243]:   [KNET  ] host: host: 1 has no active links
Jan 22 13:03:11 l-103 corosync[41243]:   [KNET  ] host: host: 112 (passive) best link: 0 (pri: 1)
Jan 22 13:03:11 l-103 corosync[41243]:   [KNET  ] host: host: 112 has no active links
Jan 22 13:03:11 l-103 corosync[41243]:   [KNET  ] host: host: 112 (passive) best link: 0 (pri: 1)
Jan 22 13:03:11 l-103 corosync[41243]:   [KNET  ] host: host: 112 has no active links
Jan 22 13:03:11 l-103 corosync[41243]:   [KNET  ] host: host: 1 (passive) best link: 0 (pri: 1)
Jan 22 13:03:11 l-103 corosync[41243]:   [KNET  ] host: host: 1 has no active links
Jan 22 13:03:12 l-103 corosync[41243]:   [KNET  ] link: Resetting MTU for link 0 because host 1 joined
Jan 22 13:03:12 l-103 corosync[41243]:   [KNET  ] host: host: 1 (passive) best link: 0 (pri: 1)
Jan 22 13:03:12 l-103 corosync[41243]:   [KNET  ] link: Resetting MTU for link 0 because host 107 joined
Jan 22 13:03:12 l-103 corosync[41243]:   [KNET  ] host: host: 107 (passive) best link: 0 (pri: 1)
Jan 22 13:03:12 l-103 corosync[41243]:   [KNET  ] link: Resetting MTU for link 0 because host 104 joined
Jan 22 13:03:12 l-103 corosync[41243]:   [KNET  ] host: host: 104 (passive) best link: 0 (pri: 1)
Jan 22 13:03:12 l-103 corosync[41243]:   [KNET  ] link: Resetting MTU for link 0 because host 111 joined
Jan 22 13:03:12 l-103 corosync[41243]:   [KNET  ] host: host: 111 (passive) best link: 0 (pri: 1)
Jan 22 13:03:12 l-103 corosync[41243]:   [KNET  ] pmtud: Global data MTU changed to: 1397
Jan 22 13:03:13 l-103 corosync[41243]:   [KNET  ] link: Resetting MTU for link 0 because host 102 joined
Jan 22 13:03:13 l-103 corosync[41243]:   [KNET  ] host: host: 102 (passive) best link: 0 (pri: 1)
Jan 22 13:03:13 l-103 corosync[41243]:   [KNET  ] link: Resetting MTU for link 0 because host 105 joined
Jan 22 13:03:13 l-103 corosync[41243]:   [KNET  ] link: Resetting MTU for link 0 because host 112 joined
Jan 22 13:03:13 l-103 corosync[41243]:   [KNET  ] host: host: 105 (passive) best link: 0 (pri: 1)
Jan 22 13:03:13 l-103 corosync[41243]:   [KNET  ] host: host: 112 (passive) best link: 0 (pri: 1)
Jan 22 13:03:13 l-103 corosync[41243]:   [KNET  ] link: Resetting MTU for link 0 because host 106 joined
Jan 22 13:03:13 l-103 corosync[41243]:   [KNET  ] host: host: 106 (passive) best link: 0 (pri: 1)
It's difficult to even check, because every node could have a different understanding of the quorum...

Also some things are surprising:
Code:
Jan 22 13:03:13 l-103 corosync[41243]:   [TOTEM ] A new membership (67.10f35) was formed. Members
Jan 22 13:03:13 l-103 corosync[41243]:   [QUORUM] Members[1]: 103
Jan 22 13:03:13 l-103 corosync[41243]:   [MAIN  ] Completed service synchronization, ready to provide service.
Jan 22 13:03:13 l-103 corosync[41243]:   [QUORUM] Sync members[1]: 103
Jan 22 13:03:13 l-103 corosync[41243]:   [TOTEM ] A new membership (67.10f39) was formed. Members
Jan 22 13:03:13 l-103 corosync[41243]:   [QUORUM] Members[1]: 103
Jan 22 13:03:13 l-103 corosync[41243]:   [MAIN  ] Completed service synchronization, ready to provide service.
Jan 22 13:03:13 l-103 corosync[41243]:   [QUORUM] Sync members[1]: 103
in total this "loops" many times, for ~1000 lines, in same second.


links being marked down can also mean that they struggle to keep up or lose single packets. could you maybe describe the network setup/corosync configuration/cluster size?
I think this "link down" does not refer to ethernet links, but to KNET UDP links ("connections" would be slighly better).
When I stop corosync service on host 110, I get:

Code:
Jan 22 15:28:23 l-103 corosync[494507]:   [KNET  ] udp: Received ICMP error from 10.1.1.110: Connection refused 10.1.1.110
Jan 22 15:28:23 l-103 corosync[494507]:   [KNET  ] udp: Setting down host 110 link 0
Jan 22 15:28:23 l-103 corosync[494507]:   [KNET  ] link: host: 110 link: 0 is down
Jan 22 15:28:23 l-103 corosync[494507]:   [KNET  ] host: host: 110 (passive) best link: 0 (pri: 1)
Jan 22 15:28:23 l-103 corosync[494507]:   [KNET  ] host: host: 110 has no active links
and when starting again

[KNET ] pmtud: Starting PMTUD for host: 110 link: 0
[KNET ] udp: detected kernel MTU: 1500


I have a top -d 0.2 and ping running beside in different terminal and even if a "load" the network a bit with a "flood ping", things work well:

Code:
root@l-103:/home/sdettmer/work/corosync/corosync-pve# ping -f l-110
PING l-110.x.net (10.1.1.110) 56(84) bytes of data.
.^C
--- l-110.x.net ping statistics ---
285355 packets transmitted, 285354 received, 0.000350441% packet loss, time 33961ms
rtt min/avg/max/mdev = 0.081/0.112/0.733/0.012 ms, ipg/ewma 0.119/0.113 ms
(this ran while I stopped corosync on 110, waited maybe 20 secs, and restarted it).

Maybe I leave the debugger running, because then it works lol :) just kidding
 
it is possible that you are running into some old, already fixed bug.. note that corosync is very latency sensitive, links being marked down can also mean that they struggle to keep up or lose single packets. could you maybe describe the network setup/corosync configuration/cluster size?
Interestingly this cluster has 12 nodes, but in
I wrote that with more than 10 it is unstable, and then found it working with 12.

I think then I did not notice 100%CPU, but seems I have a related issue. I plotted two hours memory usage data of corosync, but it seems to be stable (i.e. not explaining the OOM kill).

Network essentially are little devices (i5-10400H CPU @ 2.60GHz, 8 cores, 32 GB RAM, 1 TB SSD, I219-LM), mostly idle, directly on a switch (some cisco enterprise grade I think), 1Gbe (single NIC for all traffic). Some nodes run 1-2 idle Devuan linux VMs (cpu <10%).

Any suggestions what to test / try / do are welcome.
 
Last edited:
well, lower end hardware and a single shared NIC can cause corosync to get out of whack if that link is overloaded. and once it starts flapping links without them really going down hard, it can lead to never recovering because re-syncing causes more network load but can never finish with the network not being stable.
 
as practice has shown, after 10 nodes to the cluster not allocated to a separate network/vlan leads to problems
make a separate vlan for crorosync, this will solve your problems, especially if the cluster grows further
 
as practice has shown, after 10 nodes to the cluster not allocated to a separate network/vlan leads to problems
make a separate vlan for crorosync, this will solve your problems, especially if the cluster grows further
I could setup better network monitoring, but since the network is idle, it actually practically is a dedicated LAN, and I never saw any LAN error, delay or paket loss, even after terabytes of test data. I could test further.
When I generate load on the network, I don't see any issue with corosync, in other words, with network load I'm unable to reproduce the issue. Normally, this cluster was idle (ran a few VMs that did "nothing"), as well and the network. Of course in detail it is hard to say for rare conditions, maybe it happens when a VM makes automatic software upgrade or whatever, especially since I'm unable to reproduce (provoke) the issue.

If a 1 Gbe link is not sufficient during idle time (i.e. nothing changes on the cluster), then I think this could possibly indicate a software bug. Actually consuming 100%CPU and/or gigabytes of memory (OOM kill) could really indicate a bug. Unfortunately, the used software (knet, libqb and corosync) don't support consistency checks or stat reports on their data (like job counters, jobs/sec stats, error and retry counters, except overlong execution detection, which happens to report such situations) and apparently use a quite complex, hard to test logic inside - maybe an issue after a certain rare (network) error condition. So its difficult to get pointers into areas where to look at, for me, and any hints are appreciated!
(Also, if a single node corosync 100%CPU pulls down the entire cluster possibly is not the best implementation of HA.)

What should I do?
Setup a VLAN for corosync?
does the cluster fall apart? do the nodes become unavailable?
and also, the fact that you have no vm activity does not = that you have no activity inside corosync these are different things, transport traffic is always there and it is critical to minimal delays
I say this with confidence because I went through all the stages of building large clusters, I got a lot of bumps on my forehead :)
that's why I tell you that everything above 10 nodes in a cluster should be removed either to a separate physical network or to a separate isolated vlan, I talked to people who confirmed my words after 10 nodes, problems with non-isolated corosync traffic began
maybe this will save you from your problem, maybe not
 
Last edited:
does the cluster fall apart? do the nodes become unavailable?
at least they get "red" and non-working in the web GUI.
I think as long as more than half the nodes are "in", the cluster itself works.
and also, the fact that you have no vm activity does not = that you have no activity inside
sure (also an "idle" VM of course has some load, possibly auto-updates and whatnot)
corosync these are different things, transport traffic is always there
and it is critical to minimal delays
I stopped corosync for several seconds with interactive debugger and neither could provoke increased memory usage nor other unexpected results nor crashes, also nodes with 100% CPU on corosync see to work sometimes (before, I did not notice that sometimes nodes have 100% CPU on corosync). So I think "minimal delays" means "below some hundreds (or thousands) of microseconds" and from my tests (long pings etc) that's given. But who knows, maybe I have some strange situation where ping works but UDP does not always or so...

I say this with confidence because I went through all the stages of building large clusters, I got a lot of bumps on my forehead :)
that's why I tell you that everything above 10 nodes in a cluster should be removed either to a separate physical network or to a separate isolated vlan, I talked to people who confirmed my words after 10 nodes, problems with non-isolated corosync traffic began
Thank you for the suggestion and help.
I will try to get another VLAN on the switch (I'm in a corporate environment, so it may take some time).
maybe this will save you from your problem, maybe not
OK, I'll give it a try!

However, would be great to spot the cause, the reason of this behavior, possibly a bug, but it is time consuming for me.
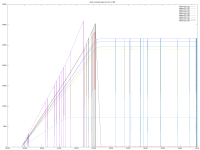
I made a scrip observing relative memory usage and plotted diagrams, only to find it is stable. Interestingy, it was stable at 26 gigabytes on most nodes (each close together). That are quite interesting results, but unfortunately of no help...
 
I have been assigned to different tasks, so VLAN setup still is in queue, but I think there could be a memory leak in corosync.
I gathered some data (ansible all -m shell -a 'echo -n $(hostname) $(date "+%Y-%m-%d %H:%M:%S") " "; smem -P "corosync"|grep -v grep|grep "/usr/sbin/corosync -f"' | grep corosync | tee -a memory-usage.lst).
It seems memory usage increases to memory limit (32 GB) within a day. Then some instances are killed by OOM:

Code:
root@labhen197-101:~# journalctl --grep OOM
-- Boot 62d548602e514db6a6c9817adc461ff8 --
Jan 16 18:02:25 labhen197-101 systemd[1]: corosync.service: A process of this unit has been killed by the OOM killer.
Jan 20 11:42:11 labhen197-101 systemd[1]: system.slice: A process of this unit has been killed by the OOM killer.
-- Boot f0dfe0203a6d4971acca9f8d1b10281d --
-- Boot 20563d87c62d463aa3d8d511af6b4fcb --
Feb 04 22:33:06 labhen197-101 systemd[1]: corosync.service: A process of this unit has been killed by the OOM killer.
root@labhen197-101:~#
[0] 1:vim  2:watch  3:vim  4:bash- 5:ssh*
and some others remain on high level
Code:
top - 16:35:42 up 24 days, 54 min,  1 user,  load average: 0.00, 0.02, 0.01
Tasks: 342 total,   1 running, 341 sleeping,   0 stopped,   0 zombie
%Cpu(s):  0.1 us,  0.2 sy,  0.0 ni, 99.4 id,  0.2 wa,  0.0 hi,  0.1 si,  0.0 st
MiB Mem :  31732.8 total,   2108.2 free,  27333.2 used,   2830.4 buff/cache
MiB Swap:   8192.0 total,   8192.0 free,      0.0 used.   4399.6 avail Mem
    PID USER      PR  NI    VIRT    RES    SHR S  %CPU  %MEM     TIME+ COMMAND
2180941 root      rt   0   24.5g  24.1g  52960 S   1.0  77.7     28,24 corosync
   1311 www-data  20   0  374792 171144  29824 S   0.0   0.5   0:20.29 pveproxy
   1204 root      20   0  382524 154152  12544 S   0.0   0.5   0:45.36 pvedaemon worke

just as an intermediate update

corosync-labhen-197-memory-plot-4.png