Corosync KNET Flapping

ikogan

Well-Known Member
Apr 8, 2017
39
2
48
39
Every so often (like right now), I'll start seeing a lot of KNET logs about a link going down and coming back up. Sometimes rebooting one node will fix it, sometimes it won't. It seems to happen randomly after node reboots or some other event. How can I determine which node is causing this or what part of the infrastructure is causing it?

I have 2 10GbE interfaces and 2 GbE interfaces LAGd together on each host except one, which also has 2 10GbE but 4 GbE all lagged together. Each logical interface trunks several VLANs.

1 of the 10GbE VLANs contains the main corosync network as well as the Ceph front side network. The other 10GbE VLAN contains the secondary corosync ring and the Ceph back side network. Each 10GbE link is connected via DAC to a different switch. Here's the logs I see on each node:

Code:
Jan 24 20:23:31 pve2 corosync[6080]:   [KNET  ] link: host: 5 link: 1 is down
Jan 24 20:23:31 pve2 corosync[6080]:   [KNET  ] host: host: 5 (passive) best link: 0 (pri: 1)
Jan 24 20:23:34 pve2 corosync[6080]:   [KNET  ] rx: host: 5 link: 1 is up
Jan 24 20:23:34 pve2 corosync[6080]:   [KNET  ] link: Resetting MTU for link 1 because host 5 joined
Jan 24 20:23:34 pve2 corosync[6080]:   [KNET  ] host: host: 5 (passive) best link: 0 (pri: 1)
Jan 24 20:23:34 pve2 corosync[6080]:   [KNET  ] pmtud: Global data MTU changed to: 1397

Here's my corosync.conf:

Code:
logging {
  debug: off
  to_syslog: yes
}

nodelist {
  node {
    name: pve1
    nodeid: 4
    quorum_votes: 1
    ring0_addr: 10.10.0.32
    ring1_addr: 10.13.1.4
  }
  node {
    name: pve2
    nodeid: 1
    quorum_votes: 1
    ring0_addr: 10.10.0.1
    ring1_addr: 10.13.1.1
  }
  node {
    name: pve3
    nodeid: 3
    quorum_votes: 1
    ring0_addr: 10.10.0.2
    ring1_addr: 10.13.1.2
  }
  node {
    name: pve4
    nodeid: 2
    quorum_votes: 1
    ring0_addr: 10.10.0.3
    ring1_addr: 10.13.1.3
  }
  node {
    name: pve5
    nodeid: 5
    quorum_votes: 1
    ring0_addr: 10.10.0.20
    ring1_addr: 10.13.1.5
  }
}

quorum {
  provider: corosync_votequorum
}

totem {
  cluster_name: PVE
  config_version: 6
  interface {
    bindnetaddr: 10.10.0.1
    ringnumber: 0
  }
  interface {
    bindnetaddr: 10.13.1.1
    ringnumber: 1
  }
  ip_version: ipv4
  rrp_mode: passive
  secauth: on
  version: 2
}

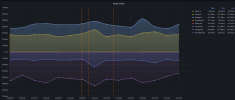
Here's a graph of traffic from the switches over the last 15 minutes (ignore the vertical lines):
Screenshot from 2023-01-24 20-44-28.png

Ring 0 is the "Private" network and Ring 1 is the "Secondary" network, which shares a VLAN with the "Storage" network. It looks like it's Ring 1 that's flapping...but why?
 
Last edited:
1 of the 10GbE VLANs contains the main corosync network as well as the Ceph front side network. The other 10GbE VLAN contains the secondary corosync ring

So, you have 2 rings, on same bond of 2x10gb interfaces ? if yes, it's don't make too much sense, you already have redundancy at bond level.

(BTW, which bond mode do you use ?)
 
The 10 GbE interfaces are not bonded, only the 1 GbE interfaces are bonded and those are used for "public" VM traffic, they're not used for Proxmox clustering or Ceph. They're using LACP and the switch reports that it's fine.

Here's an example of one of the host's `/etc/network/interfaces`:

Code:
❯ cat interfaces
auto lo
iface lo inet loopback

iface eno1 inet manual

iface enp5s0 inet manual

iface enp3s0f0 inet manual

iface enp3s0f1 inet manual

auto bond0
iface bond0 inet manual
    bond-slaves eno1 enp5s0
    bond-miimon 100
    bond-mode 802.3ad
    bond-xmit-hash-policy layer2+3
#Public Trunk

auto vmbr0
iface vmbr0 inet manual
    bridge-ports bond0
    bridge-stp off
    bridge-fd 0
    bridge-vlan-aware yes
    bridge-vids 2-4094
#Public Trunk

auto vmbr0.20
iface vmbr0.20 inet static
    address 10.1.42.32/24
    gateway 10.1.42.254
#Public

auto vmbr1
iface vmbr1 inet manual
    bridge-ports enp3s0f0
    bridge-stp off
    bridge-fd 0
    bridge-vlan-aware yes
    bridge-vids 2-4094
#Private Trunk

auto vmbr1.1
iface vmbr1.1 inet static
    address 10.10.0.32/16
#Private

auto vmbr2
iface vmbr2 inet manual
    bridge-ports enp3s0f1
    bridge-stp off
    bridge-fd 0
#Cluster Trunk

auto vmbr2.11
iface vmbr2.11 inet static
    address 10.11.1.4/16
#Cluster Storage

auto vmbr2.13
iface vmbr2.13 inet static
    address 10.13.1.4/16
#Cluster Secondary Ring
 
Last edited:
ah ok !

if you don't have any vms running on vmbr1 && vmbr2, do you have tried to tag enp3s0f0 && enp3s0f1 directly without any vmbr1/2 ?


Another idea: what is you mac-address-ageing timeout on your physical switch ? some have 5min timeout, it could be too low. 30min-2h should be more safe.

Thanks for all of your help! I do have VMs running on vmbr1, those consume ceph client traffic. Not ideal, but as the graph shows, they're not saturated in this situation and the issue is happening on vmbr2.13. vmbr2 is shared between the Ceph backside network and the secondary ring. That _could_ create problems during heavy replication but that's not happening right now.

vmbr1 and vmbr2 are on two separate Unifi Aggregation switches (https://store.ui.com/collections/unifi-network-switching/products/unifi-switch-aggregation). I can't seem to find any docs on MAC address aging or anything similar for these switches, nor do I see any way to determine the defaults.

All of the switches have DHCP Snooping, Jumbo Frames, and Spanning Tree RTSP but Flow Control is off. The hosts do not have Jump Frames on at the moment, only the switches. vmbr1 and vmbr2 are generally configured identically so I'm not sure why this is _only_ happening on vmbr2. It feels like one of the 5 NICs might be having trouble. Is there a way to determine if one of the hosts or ports is causing the problem without shutting down one host at a time?
 
do you have disabled rstp on ports where proxmox is plugged ? you really don't want rstp converge lag on your corosync network.
(if a nic is flapping on 1 node, or node reboot, it could hang all ports where rstp is enabled until convergence is done)


about bridge ageing timeout, you can change it command line, it seem to be 300s by default, could be too low.

https://dl.ubnt.com/guides/edgemax/EdgeSwitch_CLI_Command_Reference_UG.pdf (page 313)
 
Sorry, I've been on a trip for the past week or so. Anyway, thanks for the tip, I've disabled RSTP and LLDP on ports connected to the cluster nodes. We'll see if that helps.
 
Hi! i have the same situation, I see a lot of flapping in my corosync interfaces. What I have found is that using corosync in bonded interfaces, in my case double bonding (linux HA bonding over two lacp bonds to different switches and racks ) is actually causing this flapping, actually without low or no traffic in any of the interfaces over a local 1Gbps network with Cisco 3750Switches)

I have added a second ring, a simple network port to all the nodes in the cluster and while corosync still flags the bonded node as down/up constantly, it is always using the non-bonded port.

Before adding the second interface
Mar 15 23:26:28 proxmox-1 corosync[1563]: [TOTEM ] Retransmit List: 3b13
Mar 15 23:26:47 proxmox-1 corosync[1563]: [KNET ] link: host: 3 link: 0 is down
Mar 15 23:26:47 proxmox-1 corosync[1563]: [KNET ] host: host: 3 (passive) best link: 1 (pri: 1)
Mar 15 23:26:53 proxmox-1 corosync[1563]: [KNET ] rx: host: 3 link: 0 is up
Mar 15 23:26:53 proxmox-1 corosync[1563]: [KNET ] host: host: 3 (passive) best link: 0 (pri: 10)
Mar 15 23:26:59 proxmox-1 corosync[1563]: [TOTEM ] Retransmit List: 3ba3
Mar 15 23:26:59 proxmox-1 corosync[1563]: [KNET ] link: host: 5 link: 0 is down
Mar 15 23:26:59 proxmox-1 corosync[1563]: [KNET ] host: host: 5 (passive) best link: 1 (pri: 1)
Mar 15 23:27:05 proxmox-1 corosync[1563]: [KNET ] rx: host: 5 link: 0 is up
Mar 15 23:27:05 proxmox-1 corosync[1563]: [KNET ] host: host: 5 (passive) best link: 0 (pri: 10)
Mar 15 23:27:30 proxmox-1 corosync[1563]: [KNET ] link: host: 5 link: 0 is down
Mar 15 23:27:30 proxmox-1 corosync[1563]: [KNET ] host: host: 5 (passive) best link: 1 (pri: 1)
Mar 15 23:27:36 proxmox-1 corosync[1563]: [KNET ] rx: host: 5 link: 0 is up
Mar 15 23:27:36 proxmox-1 corosync[1563]: [KNET ] host: host: 5 (passive) best link: 0 (pri: 10)
Mar 15 23:27:51 proxmox-1 corosync[1563]: [KNET ] link: host: 3 link: 0 is down
Mar 15 23:27:51 proxmox-1 corosync[1563]: [KNET ] host: host: 3 (passive) best link: 1 (pri: 1)
Mar 15 23:27:57 proxmox-1 corosync[1563]: [KNET ] rx: host: 3 link: 0 is up
Mar 15 23:27:57 proxmox-1 corosync[1563]: [KNET ] host: host: 3 (passive) best link: 0 (pri: 10)

After adding the second interface
Mar 15 23:44:36 proxmox-1 corosync[1563]: [KNET ] host: host: 3 (passive) best link: 1 (pri: 20)
Mar 15 23:45:12 proxmox-1 corosync[1563]: [KNET ] link: host: 5 link: 0 is down
Mar 15 23:45:12 proxmox-1 corosync[1563]: [KNET ] host: host: 5 (passive) best link: 1 (pri: 20)
Mar 15 23:45:17 proxmox-1 corosync[1563]: [KNET ] rx: host: 5 link: 0 is up
Mar 15 23:45:17 proxmox-1 corosync[1563]: [KNET ] host: host: 5 (passive) best link: 1 (pri: 20)
Mar 15 23:45:44 proxmox-1 corosync[1563]: [KNET ] link: host: 5 link: 0 is down
Mar 15 23:45:44 proxmox-1 corosync[1563]: [KNET ] host: host: 5 (passive) best link: 1 (pri: 20)
Mar 15 23:45:50 proxmox-1 corosync[1563]: [KNET ] rx: host: 5 link: 0 is up
Mar 15 23:45:50 proxmox-1 corosync[1563]: [KNET ] host: host: 5 (passive) best link: 1 (pri: 20)
Mar 15 23:47:08 proxmox-1 corosync[1563]: [KNET ] link: host: 3 link: 0 is down
Mar 15 23:47:08 proxmox-1 corosync[1563]: [KNET ] host: host: 3 (passive) best link: 1 (pri: 20)
Mar 15 23:47:14 proxmox-1 corosync[1563]: [KNET ] rx: host: 3 link: 0 is up
Mar 15 23:47:14 proxmox-1 corosync[1563]: [KNET ] host: host: 3 (passive) best link: 1 (pri: 20)

It would be great if anyone knows how to avoid the bonding to create this corosync issues.
 
The interfaces I have for my corosync rings are not bonded. This just started happening again today and I'm not sure what changed. I don't see any errors so far on the links but I'm seeing constant flapping.

If this is related to mac address aging, why would it have such a weird pattern? Sometimes it won't happen for months and then suddenly start happening constantly for weeks. Usually this goes away on _some_ reboots. Is there a way to determine more specifically what is causing Corosync to think the link is down?
what is your cpu model model && kernel version ?

On my production, I have seen sporadic retransmit on my amd epyc cluster, but never on my intel.
and with kernel >6 + amd, I had weird retransmit flood needing a reboot of node.

(I known that amd could have some bug with l3cache flush, cause some latencies. fixed recently in last kernel 5.15)
 
So this cluster has:

1. Intel Core i7-9700k w/Intel Corporation 82599ES 10-Gigabit SFI/SFP+ Network Connection (rev 01)
2. Intel Xeon E3-1240L v5 w/Intel Corporation 82599ES 10-Gigabit SFI/SFP+ Network Connection (rev 01)
3. Intel Xeon D-1521 w/Intel Corporation 82599ES 10-Gigabit SFI/SFP+ Network Connection (rev 01)
4. Intel Xeon D-1521 w/Intel Corporation 82599ES 10-Gigabit SFI/SFP+ Network Connection (rev 01)
5. Intel Xeon E5-2630 v3 w/Cisco Systems Inc VIC Ethernet NIC (rev a2)

I believe they're all running kernel 5.15.85-1-pve.

The internet thing is that this cluster is also running Ceph and Kubernetes. Neither of those two pieces are reporting any issues between the nodes. I believe that the 5th node, the Cisco UCS, is the culprit here because it also sometimes gets fenced. I also don't understand why it's getting fenced. I recently setup boot recording in the BMC. The recording after the last fencing just showed a clean login screen, followed by a black screen, followed by a clean bootup.

This fencing is using the standard software watchdog.
 
you can have stats with

corosync-cmapctl -m stats

(for example, on a different host than cisco ucs. )

you should see tx/rx retries for each target node.

launch this command on each host, and try to corelatte if you have a specific target node with errors from all others nodes.
 
There are 0 errors on all nodes... There are retries across all nodes but no node is an outlier. In the logs, it always seems to be link 1 that's failing, never link 0. Looking at the logs some more, every node claims that "host 5 joined", host 5 claims every other node joined. Since this node is also getting fenced, it makes sense that host 5, which is the Cisco UCS is the troublemaker.

The question is why... What causes KNET to consider a link to be down?

Edit: I discovered that I commented on another person's related issue about this last year: https://forum.proxmox.com/threads/w...87892-knet-link-host-2-link-0-is-down.109661/

@fabian helped explain what makes corosync think the link is down. Since they suggested dumping the stats on host 5, here they are:

Code:
...
stats.knet.node1.link1.connected (u8) = 1
stats.knet.node1.link1.down_count (u32) = 13
stats.knet.node1.link1.enabled (u8) = 1
stats.knet.node1.link1.latency_ave (u32) = 123
stats.knet.node1.link1.latency_max (u32) = 470
stats.knet.node1.link1.latency_min (u32) = 123
stats.knet.node1.link1.latency_samples (u32) = 2048
stats.knet.node1.link1.mtu (u32) = 1397
stats.knet.node1.link1.rx_data_bytes (u64) = 0
stats.knet.node1.link1.rx_data_packets (u64) = 0
stats.knet.node1.link1.rx_ping_bytes (u64) = 118352
stats.knet.node1.link1.rx_ping_packets (u64) = 4552
stats.knet.node1.link1.rx_pmtu_bytes (u64) = 306511
stats.knet.node1.link1.rx_pmtu_packets (u64) = 435
stats.knet.node1.link1.rx_pong_bytes (u64) = 117806
stats.knet.node1.link1.rx_pong_packets (u64) = 4531
stats.knet.node1.link1.rx_total_bytes (u64) = 542669
stats.knet.node1.link1.rx_total_packets (u64) = 9518
stats.knet.node1.link1.rx_total_retries (u64) = 0
stats.knet.node1.link1.tx_data_bytes (u64) = 0
stats.knet.node1.link1.tx_data_errors (u32) = 0
stats.knet.node1.link1.tx_data_packets (u64) = 0
stats.knet.node1.link1.tx_data_retries (u32) = 0
stats.knet.node1.link1.tx_ping_bytes (u64) = 363440
stats.knet.node1.link1.tx_ping_errors (u32) = 0
stats.knet.node1.link1.tx_ping_packets (u64) = 4543
stats.knet.node1.link1.tx_ping_retries (u32) = 0
stats.knet.node1.link1.tx_pmtu_bytes (u64) = 344448
stats.knet.node1.link1.tx_pmtu_errors (u32) = 0
stats.knet.node1.link1.tx_pmtu_packets (u64) = 234
stats.knet.node1.link1.tx_pmtu_retries (u32) = 0
stats.knet.node1.link1.tx_pong_bytes (u64) = 364160
stats.knet.node1.link1.tx_pong_errors (u32) = 0
stats.knet.node1.link1.tx_pong_packets (u64) = 4552
stats.knet.node1.link1.tx_pong_retries (u32) = 0
stats.knet.node1.link1.tx_total_bytes (u64) = 1072048
stats.knet.node1.link1.tx_total_errors (u64) = 0
stats.knet.node1.link1.tx_total_packets (u64) = 9329
stats.knet.node1.link1.up_count (u32) = 13
...
stats.knet.node2.link1.connected (u8) = 1
stats.knet.node2.link1.down_count (u32) = 12
stats.knet.node2.link1.enabled (u8) = 1
stats.knet.node2.link1.latency_ave (u32) = 125
stats.knet.node2.link1.latency_max (u32) = 483
stats.knet.node2.link1.latency_min (u32) = 125
stats.knet.node2.link1.latency_samples (u32) = 2048
stats.knet.node2.link1.mtu (u32) = 1397
stats.knet.node2.link1.rx_data_bytes (u64) = 0
stats.knet.node2.link1.rx_data_packets (u64) = 0
stats.knet.node2.link1.rx_ping_bytes (u64) = 118430
stats.knet.node2.link1.rx_ping_packets (u64) = 4555
stats.knet.node2.link1.rx_pmtu_bytes (u64) = 316562
stats.knet.node2.link1.rx_pmtu_packets (u64) = 452
stats.knet.node2.link1.rx_pong_bytes (u64) = 117832
stats.knet.node2.link1.rx_pong_packets (u64) = 4532
stats.knet.node2.link1.rx_total_bytes (u64) = 552824
stats.knet.node2.link1.rx_total_packets (u64) = 9539
stats.knet.node2.link1.rx_total_retries (u64) = 0
stats.knet.node2.link1.tx_data_bytes (u64) = 0
stats.knet.node2.link1.tx_data_errors (u32) = 0
stats.knet.node2.link1.tx_data_packets (u64) = 0
stats.knet.node2.link1.tx_data_retries (u32) = 0
stats.knet.node2.link1.tx_ping_bytes (u64) = 363440
stats.knet.node2.link1.tx_ping_errors (u32) = 0
stats.knet.node2.link1.tx_ping_packets (u64) = 4543
stats.knet.node2.link1.tx_ping_retries (u32) = 0
stats.knet.node2.link1.tx_pmtu_bytes (u64) = 345920
stats.knet.node2.link1.tx_pmtu_errors (u32) = 0
stats.knet.node2.link1.tx_pmtu_packets (u64) = 235
stats.knet.node2.link1.tx_pmtu_retries (u32) = 0
stats.knet.node2.link1.tx_pong_bytes (u64) = 364400
stats.knet.node2.link1.tx_pong_errors (u32) = 0
stats.knet.node2.link1.tx_pong_packets (u64) = 4555
stats.knet.node2.link1.tx_pong_retries (u32) = 0
stats.knet.node2.link1.tx_total_bytes (u64) = 1073760
stats.knet.node2.link1.tx_total_errors (u64) = 0
stats.knet.node2.link1.tx_total_packets (u64) = 9333
stats.knet.node2.link1.up_count (u32) = 12
...
stats.knet.node3.link1.connected (u8) = 1
stats.knet.node3.link1.down_count (u32) = 12
stats.knet.node3.link1.enabled (u8) = 1
stats.knet.node3.link1.latency_ave (u32) = 159
stats.knet.node3.link1.latency_max (u32) = 673
stats.knet.node3.link1.latency_min (u32) = 159
stats.knet.node3.link1.latency_samples (u32) = 2048
stats.knet.node3.link1.mtu (u32) = 1397
stats.knet.node3.link1.rx_data_bytes (u64) = 0
stats.knet.node3.link1.rx_data_packets (u64) = 0
stats.knet.node3.link1.rx_ping_bytes (u64) = 118118
stats.knet.node3.link1.rx_ping_packets (u64) = 4543
stats.knet.node3.link1.rx_pmtu_bytes (u64) = 315130
stats.knet.node3.link1.rx_pmtu_packets (u64) = 450
stats.knet.node3.link1.rx_pong_bytes (u64) = 117806
stats.knet.node3.link1.rx_pong_packets (u64) = 4531
stats.knet.node3.link1.rx_total_bytes (u64) = 551054
stats.knet.node3.link1.rx_total_packets (u64) = 9524
stats.knet.node3.link1.rx_total_retries (u64) = 0
stats.knet.node3.link1.tx_data_bytes (u64) = 0
stats.knet.node3.link1.tx_data_errors (u32) = 0
stats.knet.node3.link1.tx_data_packets (u64) = 0
stats.knet.node3.link1.tx_data_retries (u32) = 0
stats.knet.node3.link1.tx_ping_bytes (u64) = 363440
stats.knet.node3.link1.tx_ping_errors (u32) = 0
stats.knet.node3.link1.tx_ping_packets (u64) = 4543
stats.knet.node3.link1.tx_ping_retries (u32) = 0
stats.knet.node3.link1.tx_pmtu_bytes (u64) = 350336
stats.knet.node3.link1.tx_pmtu_errors (u32) = 0
stats.knet.node3.link1.tx_pmtu_packets (u64) = 238
stats.knet.node3.link1.tx_pmtu_retries (u32) = 0
stats.knet.node3.link1.tx_pong_bytes (u64) = 363440
stats.knet.node3.link1.tx_pong_errors (u32) = 0
stats.knet.node3.link1.tx_pong_packets (u64) = 4543
stats.knet.node3.link1.tx_pong_retries (u32) = 0
stats.knet.node3.link1.tx_total_bytes (u64) = 1077216
stats.knet.node3.link1.tx_total_errors (u64) = 0
stats.knet.node3.link1.tx_total_packets (u64) = 9324
stats.knet.node3.link1.up_count (u32) = 12
...
stats.knet.node4.link1.connected (u8) = 1
stats.knet.node4.link1.down_count (u32) = 13
stats.knet.node4.link1.enabled (u8) = 1
stats.knet.node4.link1.latency_ave (u32) = 90
stats.knet.node4.link1.latency_max (u32) = 430
stats.knet.node4.link1.latency_min (u32) = 90
stats.knet.node4.link1.latency_samples (u32) = 2048
stats.knet.node4.link1.mtu (u32) = 1397
stats.knet.node4.link1.rx_data_bytes (u64) = 0
stats.knet.node4.link1.rx_data_packets (u64) = 0
stats.knet.node4.link1.rx_ping_bytes (u64) = 118118
stats.knet.node4.link1.rx_ping_packets (u64) = 4543
stats.knet.node4.link1.rx_pmtu_bytes (u64) = 309366
stats.knet.node4.link1.rx_pmtu_packets (u64) = 438
stats.knet.node4.link1.rx_pong_bytes (u64) = 117728
stats.knet.node4.link1.rx_pong_packets (u64) = 4528
stats.knet.node4.link1.rx_total_bytes (u64) = 545212
stats.knet.node4.link1.rx_total_packets (u64) = 9509
stats.knet.node4.link1.rx_total_retries (u64) = 0
stats.knet.node4.link1.tx_data_bytes (u64) = 0
stats.knet.node4.link1.tx_data_errors (u32) = 0
stats.knet.node4.link1.tx_data_packets (u64) = 0
stats.knet.node4.link1.tx_data_retries (u32) = 0
stats.knet.node4.link1.tx_ping_bytes (u64) = 363440
stats.knet.node4.link1.tx_ping_errors (u32) = 0
stats.knet.node4.link1.tx_ping_packets (u64) = 4543
stats.knet.node4.link1.tx_ping_retries (u32) = 0
stats.knet.node4.link1.tx_pmtu_bytes (u64) = 340032
stats.knet.node4.link1.tx_pmtu_errors (u32) = 0
stats.knet.node4.link1.tx_pmtu_packets (u64) = 231
stats.knet.node4.link1.tx_pmtu_retries (u32) = 0
stats.knet.node4.link1.tx_pong_bytes (u64) = 363440
stats.knet.node4.link1.tx_pong_errors (u32) = 0
stats.knet.node4.link1.tx_pong_packets (u64) = 4543
stats.knet.node4.link1.tx_pong_retries (u32) = 0
stats.knet.node4.link1.tx_total_bytes (u64) = 1066912
stats.knet.node4.link1.tx_total_errors (u64) = 0
stats.knet.node4.link1.tx_total_packets (u64) = 9317
stats.knet.node4.link1.up_count (u32) = 13
...
 
Last edited:
The question is why... What causes KNET to consider a link to be down?
a link down is simply a unjoinable node (timeout). it's not related to physical link down.

if node5 is fenced, that's mean that it's loosing access to other nodes (too much latency or no reponse at all) for more than 30s-1min.


Edit: I discovered that I commented on another person's related issue about this last year: https://forum.proxmox.com/threads/w...87892-knet-link-host-2-link-0-is-down.109661/

@fabian helped explain what makes corosync think the link is down. Since they suggested dumping the stats on host 5, here they are:
It could be great to have logs from other nodes -> node5. (try to send all nodes logs)
if node5 has been fenced, the stats have been resetted on this node.


Note that you also need to check that node5 network && cpu are not overloaded when fencing occur.
 
Last edited:
Lucky for me, I have that info. From one of the other nodes:

Code:
2023-03-31T12:50:05-04:00    service 'vm:112': state changed from 'fence' to 'recovery'
2023-03-31T12:50:05-04:00    service 'vm:109': state changed from 'fence' to 'recovery'
2023-03-31T12:50:05-04:00    node 'zorya': state changed from 'fence' => 'unknown'
2023-03-31T12:49:55-04:00    node 'zorya': state changed from 'unknown' => 'fence'
2023-03-31T12:49:55-04:00    service 'vm:112': state changed from 'started' to 'fence'
2023-03-31T12:49:55-04:00    service 'vm:109': state changed from 'started' to 'fence'

Now, on that host, the primary corosync ring is VLAN shared with one of the more heavily loaded interfaces, enp9s0. The secondary ring is on enp10s0, which is shared with the ceph replication network. However, I'm not seeing outrageously heavy utilization on any interface during that time.

The logs on that node show absolutely nothing weird. Everything is ok followed by a short gap, followed by the start of the next boot.Screenshot from 2023-03-31 15-07-24.pngScreenshot from 2023-03-31 15-08-00.pngScreenshot from 2023-03-31 15-09-59.pngScreenshot from 2023-03-31 15-14-27.pngScreenshot from 2023-03-31 15-16-41.pngScreenshot from 2023-03-31 15-17-00.pngScreenshot from 2023-03-31 15-17-23.pngScreenshot from 2023-03-31 15-19-30.pngScreenshot from 2023-03-31 15-20-12.png

Although I guess the zabbix metric data stops coming in about a minute before it gets fenced. Maybe it's really hard locking up. Ok, how does that relate to the KNET flapping? Does it at all?
 
Last edited:
I've attached the cmap stats for the other nodes here. Node 1 is the node that fenced Node 5. The metrics up there are from Node 5.
 

Attachments

mmm,

you have some weird latency_max in your stats (It's really the biggest seen latency since the start of corosync).

I have look at my clusters, on 1 year, I'm around:

min: 100
avg: 100
max: 400


you have max latency like: 1149628 o_O (1s...)
and it's not only on node5.
I could be interesting to monitor this value over time, to see if it was only 1 spike since the start, or if it's occure multiple time by day.

(BTW, do you have spanning-tree enabled on your network ? I have already see this kind of spike because of spanning tree)


down_count value is a lot bigger on node5 indeed, mostly on link1 and a little bit on link0.


About the fencing log, the node logging the fencing don't really known exactly when the other was fencing, but it's around 1min indeed.
You should have corosync log in /var/log/daemon.log on node5 before it's got fenced.
 
So the node got fenced again yesterday and now I'm not seeing errors anymore.

There doesn't seem to be anything more in `daemon.log`. It includes the usual flapping followed by what looks like startup logs. Monitoring corosync stats might be a good idea. I'll try and get that worked in there to hopefully know more for next time.

That latency spike could be from when I updated the switches. There's usually something like a 1 minute reboot time on these.

Also, I thought I had disabled RSTP on these ports but apparently they _also_ had been manually configured on the ports, not just the port profile. I disabled it for real this time but that didn't seem to impact the flapping while it was still happening.

Thanks again for all of your help! Hopefully next time it happens I'll have more data.
 

About

The Proxmox community has been around for many years and offers help and support for Proxmox VE, Proxmox Backup Server, and Proxmox Mail Gateway.
We think our community is one of the best thanks to people like you!

Get your subscription!

The Proxmox team works very hard to make sure you are running the best software and getting stable updates and security enhancements, as well as quick enterprise support. Tens of thousands of happy customers have a Proxmox subscription. Get yours easily in our online shop.

Buy now!