CEPH on PVE - how much space consumed?

zaphyre

Member
Oct 6, 2020
55
4
13
35
Hi, i have a 3 node PVE/CEPH cluster currently in testing. Each node has 7 OSD, so there is a total of 21 OSD in the cluster.
I have read a lot about never ever getting your cluster to become FULL - so I have set nearfull_ratio to 0.66

Bash:
full_ratio 0.95
backfillfull_ratio 0.9
nearfull_ratio 0.66

Is there a place in the PVE webgui to have an eye on the nearfull_ratio-values? Or which cli command lets me glimpse for this value if I want to include it in my monitoring solution?

I am confused about the different locations displaying storage in the PVE GUI:

  • Datacentre -> Ceph has a "Usage" graph - which diplays the summed up capacitiy of all OSDs?
  • Node -> Ceph -> OSD has a "Used (%)" column per OSD - which afaik be the value to look for regarding nearfull_ratio, isnt it?
  • Node -> Ceph -> Pools has a "Used (%)"-column per "Pool"
  • Each storage -> Summary has a "Usage", e.g. "0.73% (40.90 GB of 5.62 TB)" - Diplaying totally different GB values than (Node -> Ceph -> Pools) while matching the percent value....

To confuse me even further I understood that RBD only consume blocks "used" in the VM on disk like in a a sparse file, so how from an admin perspective, am i keepign an eye on my disk consumption?? If i allocate lets say a 500 GB disk on an RBD for a vm, does this get accounted in any of the usage statistics?

So, basically two questions:

  1. Where to look for relevant disk usage / consumption details for nearfull or full? (cli or webui)
  2. How to prepare for disk over commitment?
Thanks a lot!

Best regards
zaph
 
  • Like
Reactions: stefano.molinaro
Hello Zaph,
Datacentre -> Ceph has a "Usage" graph - which diplays the summed up capacitiy of all OSDs?
  • Yes ((OSD size * OSD count) / 1024 ) * 1000 ✅
Node -> Ceph -> OSD has a "Used (%)" column per OSD - which afaik be the value to look for regarding nearfull_ratio, isnt it?
  • Thats the space in % that is used on the disk. In my cluster the percentages differ a little from each other
  • If on disk exceeds nearful-ratio (default: 85%) dashboard will tell you with a warning ✅
Node -> Ceph -> Pools has a "Used (%)"-column per "Pool"
  • should be the same as Datacenter but on my site it says used: 4.64TiB (73,80%) but on datacenter it says used 4.71(60%) thats strange
  • I cant explain that one ❌
  • Each storage -> Summary has a "Usage", e.g. "0.73% (40.90 GB of 5.62 TB)" - Dsiplaying totally different GB values than (Node -> Ceph -> Pools) while matching the percent value....
  • that seems to be used space of the provisioned space (see root@pve03:~# rbd du -p vm_nvme
  • not totallay accurate though in my cluster
  1. Where to look for relevant disk usage / consumption details for nearfull or full? (cli or webui)
I would look in GUI, you can check usage of pool by ceph df and for osds with ceph osd df

Code:
root@pve03:/mnt/pve/cephfs# ceph df
--- RAW STORAGE ---
CLASS     SIZE    AVAIL     USED  RAW USED  %RAW USED
nvme   7.9 TiB  3.1 TiB  4.8 TiB   4.8 TiB      60.87
TOTAL  7.9 TiB  3.1 TiB  4.8 TiB   4.8 TiB      60.87
 
--- POOLS ---
POOL                   ID  PGS   STORED  OBJECTS     USED  %USED  MAX AVAIL
device_health_metrics   1    1   10 MiB       12   30 MiB      0    702 GiB
cephfs_data             3   32   20 GiB    5.17k   61 GiB   2.80    702 GiB
cephfs_metadata         4   32  2.0 MiB       23  6.0 MiB      0    702 GiB
vm_nvme                33  256  1.6 TiB  417.30k  4.7 TiB  69.62    702 GiB

root@pve03:/mnt/pve/cephfs# ceph osd df
ID  CLASS  WEIGHT   REWEIGHT  SIZE     RAW USE  DATA     OMAP      META     AVAIL    %USE   VAR   PGS  STATUS
 0   nvme  0.87329   1.00000  894 GiB  583 GiB  581 GiB   763 KiB  1.9 GiB  311 GiB  65.21  1.07  110      up
 1   nvme  0.87329   1.00000  894 GiB  471 GiB  469 GiB    11 MiB  1.2 GiB  424 GiB  52.63  0.87  101      up
 2   nvme  0.87329   1.00000  894 GiB  568 GiB  567 GiB  1002 KiB  1.5 GiB  326 GiB  63.56  1.04  110      up
 4   nvme  0.87329   1.00000  894 GiB  503 GiB  502 GiB   790 KiB  1.2 GiB  391 GiB  56.23  0.92   99      up
 5   nvme  0.87329   1.00000  894 GiB  626 GiB  625 GiB    11 MiB  1.4 GiB  268 GiB  70.00  1.15  117      up
 6   nvme  0.87329   1.00000  894 GiB  505 GiB  504 GiB   744 KiB  1.1 GiB  389 GiB  56.49  0.93  105      up
 3   nvme  0.87329   1.00000  894 GiB  569 GiB  567 GiB    11 MiB  1.7 GiB  326 GiB  63.59  1.05  112      up
 8   nvme  0.87329   1.00000  894 GiB  563 GiB  562 GiB   802 KiB  1.0 GiB  331 GiB  62.98  1.04  107      up
 9   nvme  0.87329   1.00000  894 GiB  508 GiB  507 GiB   931 KiB  1.2 GiB  386 GiB  56.78  0.93  102      up
                       TOTAL  7.9 TiB  4.8 TiB  4.8 TiB    38 MiB   12 GiB  3.1 TiB  60.8

  1. How to prepare for disk over commitment?

According to redhat docs: https://access.redhat.com/solutions/2088031

1. ceph osd reweight as a temporary fix and keep your cluster up and running while waiting for new hardware.
Syntax: ceph osd reweight{osd-num} {weight} sudo ceph osd reweight 5 .8

2. ceph osd crush reweight is a non-temporary fix. .
Syntax: ceph osd crush reweight {name} {weight} | sudo ceph osd crush reweight osd.5 .8

3. ceph osd reweight-by-utilization
Syntax: ceph osd reweight-by-utilization threshold(> 100) | sudo ceph osd reweight-by-utilization 120

Best Regards
Jonas
 
Last edited:
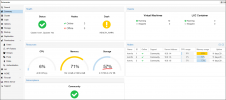
I do agree that Ceph storage utilisation be reworked in the web UI, herewith an example of a cluster where there's a critical problem but the client simply wasn't aware:

I understand that Storage here is simply a sum of all available storage on each node, perhaps exclude CephFS mounts then and include information from Ceph, or only use Ceph when it's configured.

I would rather see a storage utilisation dial that goes red at 75% for each OSD type (eg hdd / ssd / nvme). This could simply come from 'ceph df', as in:
Code:
CLASS     SIZE    AVAIL     USED  RAW USED  %RAW USED
hdd     11 TiB  2.7 TiB  8.2 TiB   8.2 TiB      74.87
ssd    2.3 TiB  2.0 TiB  306 GiB   306 GiB      13.21

Perhaps a smaller row of dials for each pool? Better yet provide a regex string (eg rbd.*) via the datacenter options list.
Code:
POOL                   ID  PGS   STORED  OBJECTS     USED  %USED  MAX AVAIL
device_health_metrics   1    1   74 MiB       24  222 MiB   0.01    615 GiB
cephfs_data             2   16   29 GiB    7.40k   86 GiB   3.79    726 GiB
cephfs_metadata         3   16  1.4 MiB       23  5.7 MiB      0    726 GiB
rbd_hdd                 4  256  2.7 TiB  722.83k  8.1 TiB  79.14    726 GiB
rbd_hdd_cache           5   64  101 GiB   26.49k  304 GiB  14.13    615 GiB
rbd_ssd                 6   64      0 B        0      0 B      0    615 GiB


The pool being at 79.14% should be a red flag already at 75%.

NB: Remember that there can be over 5% space variance on OSDs, even with the upmap balancer. Defaults also dictate near full warnings at 85% and block further writes at 95%.

1635433295473.png

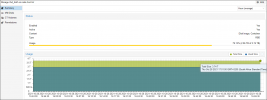
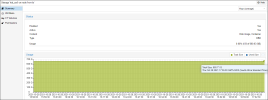
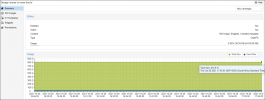
Clicking through the 3 shared storage containers:

1635433446943.png

1635433431895.png

1635433536277.png

1635433559910.png

PVE config file (/etc/pve/storage.cfg):
Code:
[root@kvm1a ~]# cat /etc/pve/storage.cfg
dir: local
        disable
        path /var/lib/vz
        content backup
        prune-backups keep-all=1
        shared 0

cephfs: shared
        path /mnt/pve/cephfs
        content snippets,vztmpl,iso

rbd: rbd_hdd
        content images,rootdir
        krbd 1
        pool rbd_hdd

rbd: rbd_ssd
        content rootdir,images
        krbd 1
        pool rbd_ssd

[root@kvm1a ~]# df -h
Filesystem                          Size  Used Avail Use% Mounted on
udev                                 32G     0   32G   0% /dev
tmpfs                               6.3G  1.9M  6.3G   1% /run
/dev/md0                             59G  8.6G   48G  16% /
tmpfs                                32G   63M   32G   1% /dev/shm
tmpfs                               5.0M     0  5.0M   0% /run/lock
/dev/fuse                           128M   36K  128M   1% /etc/pve
/dev/sdb4                            94M  5.5M   89M   6% /var/lib/ceph/osd/ceph-111
/dev/sda4                            94M  5.5M   89M   6% /var/lib/ceph/osd/ceph-110
/dev/sdf1                            97M  5.5M   92M   6% /var/lib/ceph/osd/ceph-13
/dev/sdd1                            97M  5.5M   92M   6% /var/lib/ceph/osd/ceph-11
/dev/sde1                            97M  5.5M   92M   6% /var/lib/ceph/osd/ceph-12
/dev/sdc1                            97M  5.5M   92M   6% /var/lib/ceph/osd/ceph-10
10.254.1.2,10.254.1.3,10.254.1.4:/  756G   29G  727G   4% /mnt/pve/cephfs
tmpfs                               6.3G     0  6.3G   0% /run/user/0


Warnings here would be very usefull:
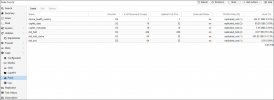
1635433835576.png

First warning for me:
1635433919217.png

Ceph CLI:
NB: Note that pool 'rbd_hdd' is at 79.14% utilisation with only 726 GiB of available storage remaining.

Code:
[root@kvm1a ~]# ceph df
--- RAW STORAGE ---
CLASS     SIZE    AVAIL     USED  RAW USED  %RAW USED
hdd     11 TiB  2.7 TiB  8.2 TiB   8.2 TiB      74.87
ssd    2.3 TiB  2.0 TiB  306 GiB   306 GiB      13.21
TOTAL   13 TiB  4.7 TiB  8.5 TiB   8.5 TiB      64.29

--- POOLS ---
POOL                   ID  PGS   STORED  OBJECTS     USED  %USED  MAX AVAIL
device_health_metrics   1    1   74 MiB       24  222 MiB   0.01    615 GiB
cephfs_data             2   16   29 GiB    7.40k   86 GiB   3.79    726 GiB
cephfs_metadata         3   16  1.4 MiB       23  5.7 MiB      0    726 GiB
rbd_hdd                 4  256  2.7 TiB  722.83k  8.1 TiB  79.14    726 GiB
rbd_hdd_cache           5   64  101 GiB   26.49k  304 GiB  14.13    615 GiB
rbd_ssd                 6   64      0 B        0      0 B      0    615 GiB


Code:
[root@kvm1a ~]# ceph df detail
--- RAW STORAGE ---
CLASS     SIZE    AVAIL     USED  RAW USED  %RAW USED
hdd     11 TiB  2.7 TiB  8.2 TiB   8.2 TiB      74.87
ssd    2.3 TiB  2.0 TiB  306 GiB   306 GiB      13.21
TOTAL   13 TiB  4.7 TiB  8.5 TiB   8.5 TiB      64.29

--- POOLS ---
POOL                   ID  PGS   STORED   (DATA)   (OMAP)  OBJECTS     USED   (DATA)   (OMAP)  %USED  MAX AVAIL  QUOTA OBJECTS  QUOTA BYTES   DIRTY  USED COMPR  UNDER COMPR
device_health_metrics   1    1   74 MiB      0 B   74 MiB       24  222 MiB      0 B  222 MiB   0.01    615 GiB            N/A          N/A     N/A         0 B          0 B
cephfs_data             2   16   29 GiB   29 GiB      0 B    7.40k   86 GiB   86 GiB      0 B   3.79    726 GiB            N/A          N/A     N/A         0 B          0 B
cephfs_metadata         3   16  1.4 MiB  1.3 MiB  8.8 KiB       23  5.7 MiB  5.6 MiB   26 KiB      0    726 GiB            N/A          N/A     N/A         0 B          0 B
rbd_hdd                 4  256  2.7 TiB  2.7 TiB  1.3 KiB  722.83k  8.1 TiB  8.1 TiB  4.0 KiB  79.14    726 GiB            N/A          N/A     N/A         0 B          0 B
rbd_hdd_cache           5   64  101 GiB  101 GiB  965 KiB   26.49k  304 GiB  304 GiB  2.8 MiB  14.13    615 GiB            N/A          N/A  13.12k         0 B          0 B
rbd_ssd                 6   64      0 B      0 B      0 B        0      0 B      0 B      0 B      0    615 GiB            N/A          N/A     N/A         0 B          0 B

Code:
[root@kvm1a ~]# ceph osd df
ID   CLASS  WEIGHT   REWEIGHT  SIZE     RAW USE  DATA     OMAP     META     AVAIL    %USE   VAR   PGS  STATUS
 10    hdd  0.90959   1.00000  931 GiB  695 GiB  693 GiB    7 KiB  1.3 GiB  237 GiB  74.58  1.16   71      up
 11    hdd  0.90959   1.00000  931 GiB  696 GiB  694 GiB      0 B  1.4 GiB  236 GiB  74.70  1.16   72      up
 12    hdd  0.90959   1.00000  931 GiB  697 GiB  695 GiB      0 B  1.4 GiB  235 GiB  74.78  1.16   69      up
 13    hdd  0.90959   1.00000  931 GiB  703 GiB  702 GiB    3 KiB  1.4 GiB  228 GiB  75.51  1.17   76      up
110    ssd  0.37700   1.00000  386 GiB   43 GiB   43 GiB  2.8 MiB  275 MiB  343 GiB  11.14  0.17   58      up
111    ssd  0.37700   1.00000  386 GiB   59 GiB   59 GiB   75 MiB  440 MiB  327 GiB  15.34  0.24   71      up
 20    hdd  1.81929   1.00000  1.8 TiB  1.4 TiB  1.4 TiB    3 KiB  2.3 GiB  468 GiB  74.87  1.16  144      up
 21    hdd  1.81929   1.00000  1.8 TiB  1.4 TiB  1.4 TiB    7 KiB  2.3 GiB  468 GiB  74.86  1.16  144      up
120    ssd  0.37700   1.00000  386 GiB   43 GiB   43 GiB      0 B  387 MiB  343 GiB  11.21  0.17   63      up
121    ssd  0.37700   1.00000  386 GiB   59 GiB   59 GiB   75 MiB  390 MiB  327 GiB  15.28  0.24   66      up
 30    hdd  1.81929   1.00000  1.8 TiB  1.4 TiB  1.4 TiB    7 KiB  2.3 GiB  467 GiB  74.95  1.17  148      up
 31    hdd  1.81929   1.00000  1.8 TiB  1.4 TiB  1.4 TiB    3 KiB  2.2 GiB  470 GiB  74.77  1.16  140      up
130    ssd  0.37700   1.00000  386 GiB   49 GiB   49 GiB   73 MiB  208 MiB  337 GiB  12.81  0.20   64      up
131    ssd  0.37700   1.00000  386 GiB   53 GiB   52 GiB      0 B  331 MiB  333 GiB  13.61  0.21   65      up
                        TOTAL   13 TiB  8.5 TiB  8.5 TiB  225 MiB   17 GiB  4.7 TiB  64.29
MIN/MAX VAR: 0.17/1.17  STDDEV: 34.39


For storage management it's not necessarily just the utilisation but the pace of change that's important. Herewith a sample graph following the average, maximum and minimum utilisations of individual OSDs over time:
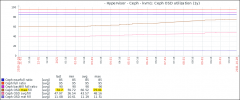
1635436195600.png

Herewith a miss leading representation of the total OSD storage space, irrespective of type or pool constraints:
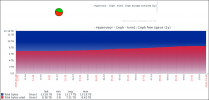
1635436108917.png

Client decided to deploy a virtual NVR, miss lead by the space reporting in the UI...


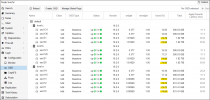
PS: Some additional monitoring metrics that can help identify bottlenecks:
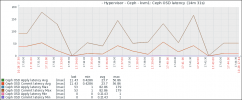
1635436044500.png
 
Last edited:
PS: At these OSD utilisation levels there isn't really spare capacity to re-distribute a failed OSD. This cluster is currently in a warning state due to 'noout' having been set, to avoid a cascading failure of other OSDs as they tried to replicate.

Code:
[root@kvm1a ~]# ceph -s
  cluster:
    id:     8476132e-4e7d-4061-ad8f-b1ec059870ee
    health: HEALTH_WARN
            noout flag(s) set

  services:
    mon: 3 daemons, quorum kvm1a,kvm1b,kvm1c (age 11d)
    mgr: kvm1a(active, since 11d), standbys: kvm1c, kvm1b
    mds: 1/1 daemons up, 2 standby
    osd: 14 osds: 14 up (since 11d), 14 in (since 10M)
         flags noout

  data:
    volumes: 1/1 healthy
    pools:   6 pools, 417 pgs
    objects: 756.86k objects, 2.9 TiB
    usage:   8.5 TiB used, 4.7 TiB / 13 TiB avail
    pgs:     417 active+clean

  io:
    client:   42 MiB/s rd, 2.7 MiB/s wr, 508 op/s rd, 163 op/s wr
    cache:    6.0 MiB/s evict, 0 op/s promote
 

About

The Proxmox community has been around for many years and offers help and support for Proxmox VE, Proxmox Backup Server, and Proxmox Mail Gateway.
We think our community is one of the best thanks to people like you!

Get your subscription!

The Proxmox team works very hard to make sure you are running the best software and getting stable updates and security enhancements, as well as quick enterprise support. Tens of thousands of happy customers have a Proxmox subscription. Get yours easily in our online shop.

Buy now!