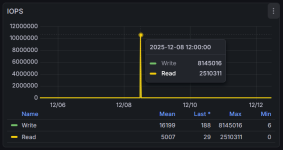
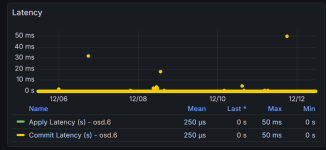
I'm seeing crazy low performance in Ceph.
I've traced it to OSD's sometimes being very slow...see below.
In 3 tests, the first is fairly slow, then fast (as fast as I expect this OSD to be), then the 3rd is crazy slow.
root@pm3:~# ceph tell osd.3 bench
{
"bytes_written": 1073741824,
"blocksize": 4194304,
"elapsed_sec": 37.700903142999998,
"bytes_per_sec": 28480533.209702797,
"iops": 6.7902882599122041
}
root@pm3:~# ceph tell osd.3 bench
{
"bytes_written": 1073741824,
"blocksize": 4194304,
"elapsed_sec": 2.3546470959999999,
"bytes_per_sec": 456009660.99082905,
"iops": 108.72117543001868
}
root@pm3:~# ceph tell osd.3 bench
{
"bytes_written": 1073741824,
"blocksize": 4194304,
"elapsed_sec": 511.19502616599999,
"bytes_per_sec": 2100454.3648500298,
"iops": 0.50078734513521905
}
Google has been less than helpful, as it could in theory be anything.
ProxMox WebUI shows CPU <25% and RAM <50% used.
Zabbix shows the 10g switch running under 100Mbps on all ports.
Hardware isn't crazy powerful, but I'm failing to find where the limit is.


