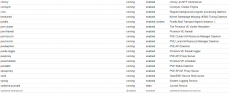
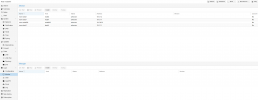
To be honest - I did not even look to see what upgrades happened till it was too late.
Octo to Pacific upgrade happened apparently with the automatic gui updates... I did not read the notes and now all my cluster ceph pool is dead as a rock.
I noticed timeout after timeout...
I manually installed the new chrony on each node thinking maybe out of sync or something...
then started seeing that none of the ceph OSDs were visible - getting ceph timeout 500 errors all over the place...
Noticed monitors were all in unknown state and no quorum
No managers were listed anymore
ceph -s times out
nothing seeds to work anymore
tried following along with upgrade but I think it may be too late...
I have 9 nodes
monitors on 1,2,3,7 and I can't remember which had the managers...
anyhow I have a ton of erros spewing in syslog and ceph commands are pretty much all stuck...
ceph: No mds server is up or the cluster is laggy
bottom line - ceph is dead... where can I start to try to recover?
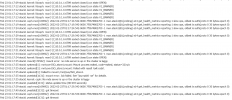
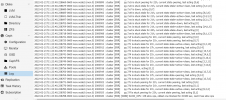
And now I see mon node space issues... all is installed to root partition I believe.. anyhow that has been an ongoing issue... I have proxmox installed to 80GB SSD and cannot sort how to expand root partition more than 18 or 20 gb it setup when originally installing PM. Had several issues over the year upgrading PM and other items... but I do not even know where to start on the ceph monitor space allocation...
Help is much appreciated as I am still learning all this fun stuff.
Did I kill my cluster because of that automated update?
Octo to Pacific upgrade happened apparently with the automatic gui updates... I did not read the notes and now all my cluster ceph pool is dead as a rock.
I noticed timeout after timeout...
I manually installed the new chrony on each node thinking maybe out of sync or something...
then started seeing that none of the ceph OSDs were visible - getting ceph timeout 500 errors all over the place...
Noticed monitors were all in unknown state and no quorum
No managers were listed anymore
ceph -s times out
nothing seeds to work anymore
tried following along with upgrade but I think it may be too late...
I have 9 nodes
monitors on 1,2,3,7 and I can't remember which had the managers...
anyhow I have a ton of erros spewing in syslog and ceph commands are pretty much all stuck...
ceph: No mds server is up or the cluster is laggy
bottom line - ceph is dead... where can I start to try to recover?


Code:
2022-02-21T11:23:39.813869-0600 osd.0 (osd.0) 4244644 : cluster [WRN] slow request osd_op(client.471789829.0:1612332 7.dc 7.2b14fadc (undecoded) ondisk+retry+write+known_if_redirected e967374) initiated 2022-02-21T02:30:29.797312-0600 currently delayed
2022-02-21T11:23:39.813873-0600 osd.0 (osd.0) 4244645 : cluster [WRN] slow request osd_op(client.471789829.0:1612332 7.dc 7.2b14fadc (undecoded) ondisk+retry+write+known_if_redirected e967508) initiated 2022-02-21T06:30:29.844746-0600 currently delayed
2022-02-21T11:23:39.813876-0600 osd.0 (osd.0) 4244646 : cluster [WRN] slow request osd_op(client.471789829.0:1612332 7.dc 7.2b14fadc (undecoded) ondisk+retry+write+known_if_redirected e967645) initiated 2022-02-21T10:30:29.892240-0600 currently delayed
2022-02-21T11:23:40.212664-0600 mon.node2 (mon.0) 2000851 : cluster [INF] mon.node2 is new leader, mons node2,stack1,node7 in quorum (ranks 0,1,3)
2022-02-21T11:23:40.219565-0600 mon.node2 (mon.0) 2000852 : cluster [DBG] monmap e14: 4 mons at {node2=[v2:10.0.1.2:3300/0,v1:10.0.1.2:6789/0],node7=[v2:10.0.1.7:3300/0,v1:10.0.1.7:6789/0],node900=[v2:10.0.90.0:3300/0,v1:10.0.90.0:6789/0],stack1=[v2:10.0.1.1:3300/0,v1:10.0.1.1:6789/0]}
2022-02-21T11:23:40.219633-0600 mon.node2 (mon.0) 2000853 : cluster [DBG] fsmap cephfs:1 {0=node2=up:active} 2 up:standby
2022-02-21T11:23:40.219653-0600 mon.node2 (mon.0) 2000854 : cluster [DBG] osdmap e967678: 14 total, 4 up, 10 in
2022-02-21T11:23:40.220140-0600 mon.node2 (mon.0) 2000855 : cluster [DBG] mgrmap e649: stack1(active, since 5d), standbys: node2, node7
2022-02-21T11:23:40.228388-0600 mon.node2 (mon.0) 2000856 : cluster [ERR] Health detail: HEALTH_ERR 1 MDSs report slow metadata IOs; mon node7 is very low on available space; mon stack1 is low on available space; 1/4 mons down, quorum node2,stack1,node7; 6 osds down; 1 host (7 osds) down; Reduced data availability: 169 pgs inactive, 45 pgs down, 124 pgs peering, 388 pgs stale; 138 slow ops, oldest one blocked for 61680 sec, osd.0 has slow ops
2022-02-21T11:23:40.228404-0600 mon.node2 (mon.0) 2000857 : cluster [ERR] [WRN] MDS_SLOW_METADATA_IO: 1 MDSs report slow metadata IOs
2022-02-21T11:23:40.228409-0600 mon.node2 (mon.0) 2000858 : cluster [ERR]     mds.node2(mds.0): 7 slow metadata IOs are blocked > 30 secs, oldest blocked for 78670 secs
2022-02-21T11:23:40.228413-0600 mon.node2 (mon.0) 2000859 : cluster [ERR] [ERR] MON_DISK_CRIT: mon node7 is very low on available space
2022-02-21T11:23:40.228416-0600 mon.node2 (mon.0) 2000860 : cluster [ERR]     mon.node7 has 1% avail
2022-02-21T11:23:40.228422-0600 mon.node2 (mon.0) 2000861 : cluster [ERR] [WRN] MON_DISK_LOW: mon stack1 is low on available space
2022-02-21T11:23:40.228428-0600 mon.node2 (mon.0) 2000862 : cluster [ERR]     mon.stack1 has 8% avail
2022-02-21T11:23:40.228432-0600 mon.node2 (mon.0) 2000863 : cluster [ERR] [WRN] MON_DOWN: 1/4 mons down, quorum node2,stack1,node7
2022-02-21T11:23:40.228437-0600 mon.node2 (mon.0) 2000864 : cluster [ERR]     mon.node900 (rank 2) addr [v2:10.0.90.0:3300/0,v1:10.0.90.0:6789/0] is down (out of quorum)
2022-02-21T11:23:40.228443-0600 mon.node2 (mon.0) 2000865 : cluster [ERR] [WRN] OSD_DOWN: 6 osds down
2022-02-21T11:23:40.228449-0600 mon.node2 (mon.0) 2000866 : cluster [ERR]     osd.8 (root=default,host=node900) is down
2022-02-21T11:23:40.228454-0600 mon.node2 (mon.0) 2000867 : cluster [ERR]     osd.9 (root=default,host=node900) is down
2022-02-21T11:23:40.228460-0600 mon.node2 (mon.0) 2000868 : cluster [ERR]     osd.10 (root=default,host=node900) is down
2022-02-21T11:23:40.228466-0600 mon.node2 (mon.0) 2000869 : cluster [ERR]     osd.11 (root=default,host=node900) is down
2022-02-21T11:23:40.228471-0600 mon.node2 (mon.0) 2000870 : cluster [ERR]     osd.12 (root=default,host=node900) is down
2022-02-21T11:23:40.228477-0600 mon.node2 (mon.0) 2000871 : cluster [ERR]     osd.13 (root=default,host=node900) is down
2022-02-21T11:23:40.228483-0600 mon.node2 (mon.0) 2000872 : cluster [ERR] [WRN] OSD_HOST_DOWN: 1 host (7 osds) down
2022-02-21T11:23:40.228488-0600 mon.node2 (mon.0) 2000873 : cluster [ERR]     host node900 (root=default) (7 osds) is down
2022-02-21T11:23:40.228527-0600 mon.node2 (mon.0) 2000874 : cluster [ERR] [WRN] PG_AVAILABILITY: Reduced data availability: 169 pgs inactive, 45 pgs down, 124 pgs peering, 388 pgs stale
2022-02-21T11:23:40.228534-0600 mon.node2 (mon.0) 2000875 : cluster [ERR]     pg 7.cd is stuck inactive for 21h, current state stale+down, last acting [0]
2022-02-21T11:23:40.228539-0600 mon.node2 (mon.0) 2000876 : cluster [ERR]     pg 7.ce is stuck peering for 21h, current state peering, last acting [0,7]
2022-02-21T11:23:40.228544-0600 mon.node2 (mon.0) 2000877 : cluster [ERR]     pg 7.cf is stuck stale for 21h, current state stale+active+clean, last acting [6,3,8]
2022-02-21T11:23:40.228550-0600 mon.node2 (mon.0) 2000878 : cluster [ERR]     pg 7.d0 is stuck stale for 21h, current state stale+active+clean, last acting [12,2,6]
2022-02-21T11:23:40.228555-0600 mon.node2 (mon.0) 2000879 : cluster [ERR]     pg 7.d1 is stuck stale for 21h, current state stale+active+clean, last acting [9,1,2]
2022-02-21T11:23:40.228561-0600 mon.node2 (mon.0) 2000880 : cluster [ERR]     pg 7.d2 is stuck stale for 21h, current state stale+active+clean, last acting [3,9,2]
2022-02-21T11:23:40.228567-0600 mon.node2 (mon.0) 2000881 : cluster [ERR]     pg 7.d3 is stuck peering for 21h, current state peering, last acting [0,6]
2022-02-21T11:23:40.228574-0600 mon.node2 (mon.0) 2000882 : cluster [ERR]     pg 7.d4 is stuck stale for 21h, current state stale+active+clean, last acting [8,6,1]
2022-02-21T11:23:40.228580-0600 mon.node2 (mon.0) 2000883 : cluster [ERR]     pg 7.d5 is stuck stale for 21h, current state stale+active+clean, last acting [13,6,7]
2022-02-21T11:23:40.228585-0600 mon.node2 (mon.0) 2000884 : cluster [ERR]     pg 7.d6 is stuck stale for 21h, current state stale+active+clean, last acting [11,1,3]
And now I see mon node space issues... all is installed to root partition I believe.. anyhow that has been an ongoing issue... I have proxmox installed to 80GB SSD and cannot sort how to expand root partition more than 18 or 20 gb it setup when originally installing PM. Had several issues over the year upgrading PM and other items... but I do not even know where to start on the ceph monitor space allocation...
Help is much appreciated as I am still learning all this fun stuff.
Did I kill my cluster because of that automated update?


