"Bulk suspend", timeout, yellow traffic cone

Dec 30, 2024
70
19
8
Munich, Germany
Dear all,

when performing maintenance on my 30+ PVE servers, I use to "Bulk suspend" all VMs and then reboot the host.
Almost every time during that suspend process, one or more VMs are reporting a timeout. This will cause the VM to stay locked with a yellow traffic cone symbol.
Note: Successfully suspended VMs show a black traffic cone.

In reality these VMs were successfully suspended.
Unlocking the VM causes the traffic cone to disappear (looks like it is shut down), "qm start xxx" will report resume from suspend and all is working fine.

Nevertheless the lock is causing the autostart to fail!

I'd expect the VM to eventually unlock once the process has finished and and show a proper symbol/state in GUI.
Upon reboot all VMs shall start normally.

With the current behaviour it's a bit cumbersome since manual intervention is required to eventually get them booting.

Am I doing something wrong?

BTW: It would be great to see the naming streamlined. Calling the same action either "suspend" (bulk action) or "hibernate" is strange.
In my eyes there is no difference if you perform a task for one or multiple targets ;-)

Best regards,
Bernhard
 
could you please provide more details? exact version you are running, VM config of affected VMs, logs of the suspension timing out, journal of the host, ..
 
I'll try to reproduce the issue on my own server.

Aside from pveversion and VM config file, which commands shall I execute and which log files are required?

I remember that the logs, accessible from GUI are very short when hibernation fails:

Code:
State saved, quitting
TASK ERROR: VM 103 qmp command 'quit' failed - got timeout

Where can I find details for that job?

After reboot autostart fails:

Code:
TASK ERROR: VM is locked (suspending)
 
that already gives us more information! you could also check the journal covering the time period of the bulk suspend. another interesting point would be to know if doing the suspends one after the other with a small break inbetween also triggers the issue, or if it is just parallel suspends which run into the timeout.
 
I've seen only parallel suspends which run into timeout, I use those most of the time.

Attached the log, interesting might be:

Code:
May 23 23:26:31 pve pveproxy[1089089]: got inotify poll request in wrong process - disabling inotify
...
May 23 23:27:05 pve pvedaemon[1089329]: VM 103 qmp command failed - VM 103 qmp command 'quit' failed - got timeout
May 23 23:27:05 pve pvedaemon[1089329]: VM 103 qmp command 'quit' failed - got timeout
 

Attachments

thanks! do you have metrics covering your host resources? if so, anything visible there during that time period?
 
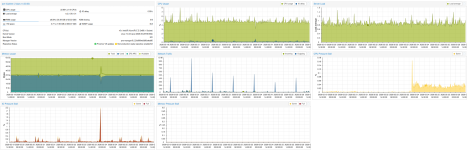
Here is a screenshot from the graphs over the last week:

1779797873879.png

I can't see a bottleneck of any kind. The "Maximum" graph setting shows a peak at load peak on May 23 22:30 at around 7.79.

The system is definitely not idle during suspend, I imagine the lz4 inline-compression from the main zpool is using a lot of CPU ressources during writes.

I have other systems which similar specs or older machines (DL380 Gen10 machines) which suffer from the same problem.

The system itself (Fujitsu TX1320 M6) is quite powerful with full-flash and 64GB DDR5 RAM:

Code:
root@pve:~# pveversion
pve-manager/9.2.2/b9984c6d90a4bd80 (running kernel: 7.0.2-6-pve)
root@pve:~# lsscsi
[0:0:0:0]    disk    ATA      SFSA240GM2AK4TO- 0013  /dev/sda
[2:0:0:0]    disk    ATA      SFSA240GM2AK4TO- 0013  /dev/sdb
[4:0:0:0]    disk    ATA      Micron_5400_MTFD U004  /dev/sdc
[5:0:0:0]    disk    ATA      Micron_5400_MTFD U004  /dev/sdd
root@pve:~# zpool status
  pool: local-tank01
 state: ONLINE
  scan: scrub repaired 0B in 00:12:17 with 0 errors on Sun May 10 00:36:18 2026
config:

    NAME                                            STATE     READ WRITE CKSUM
    local-tank01                                    ONLINE       0     0     0
      mirror-0                                      ONLINE       0     0     0
        ata-Micron_5400_MTFDDAK1T9TGB_24374B7E123B  ONLINE       0     0     0
        ata-Micron_5400_MTFDDAK1T9TGB_24374B7E0F86  ONLINE       0     0     0

errors: No known data errors

  pool: rpool
 state: ONLINE
  scan: scrub repaired 0B in 00:00:34 with 0 errors on Sun May 10 00:24:36 2026
config:

    NAME                                                             STATE     READ WRITE CKSUM
    rpool                                                            ONLINE       0     0     0
      mirror-0                                                       ONLINE       0     0     0
        ata-SFSA240GM2AK4TO-I-6B-636-STD_000060190235FE000009-part3  ONLINE       0     0     0
        ata-SFSA240GM2AK4TO-I-6B-636-STD_00006018585095000002-part3  ONLINE       0     0     0

errors: No known data errors
root@pve:~# lscpu
Architecture:                x86_64
  CPU op-mode(s):            32-bit, 64-bit
  Address sizes:             42 bits physical, 48 bits virtual
  Byte Order:                Little Endian
CPU(s):                      16
  On-line CPU(s) list:       0-15
Vendor ID:                   GenuineIntel
  Model name:                Intel(R) Xeon(R) E E-2488
    CPU family:              6
    Model:                   183
    Thread(s) per core:      2
    Core(s) per socket:      8
    Socket(s):               1
    Stepping:                1
    CPU(s) scaling MHz:      24%
    CPU max MHz:             7200,0000
    CPU min MHz:             800,0000
    BogoMIPS:                6374,40
    Flags:                   fpu vme de pse tsc msr pae mce cx8 apic sep mtrr pge mca cmov pat pse36 clflush dts acpi mmx fxsr sse sse2 ss ht tm pbe syscall nx pdpe1gb rdtscp
                             lm constant_tsc art arch_perfmon pebs bts rep_good nopl xtopology nonstop_tsc cpuid aperfmperf tsc_known_freq pni pclmulqdq dtes64 monitor ds_cpl
                             vmx smx est tm2 ssse3 sdbg fma cx16 xtpr pdcm pcid sse4_1 sse4_2 x2apic movbe popcnt tsc_deadline_timer aes xsave avx f16c rdrand lahf_lm abm 3dno
                             wprefetch cpuid_fault epb ssbd ibrs ibpb stibp ibrs_enhanced tpr_shadow flexpriority ept vpid ept_ad fsgsbase tsc_adjust bmi1 avx2 smep bmi2 erms
                             invpcid rdseed adx smap clflushopt clwb intel_pt sha_ni xsaveopt xsavec xgetbv1 xsaves split_lock_detect user_shstk avx_vnni dtherm ida arat pln p
                             ts hwp hwp_notify hwp_act_window hwp_epp hwp_pkg_req hfi vnmi umip pku ospke waitpkg gfni vaes vpclmulqdq tme rdpid movdiri movdir64b fsrm md_clea
                             r serialize pconfig arch_lbr ibt flush_l1d arch_capabilities
Virtualization features:     
  Virtualization:            VT-x
Caches (sum of all):         
  L1d:                       384 KiB (8 instances)
  L1i:                       256 KiB (8 instances)
  L2:                        16 MiB (8 instances)
  L3:                        24 MiB (1 instance)
NUMA:                       
  NUMA node(s):              1
  NUMA node0 CPU(s):         0-15
Vulnerabilities:             
  Gather data sampling:      Not affected
  Ghostwrite:                Not affected
  Indirect target selection: Not affected
  Itlb multihit:             Not affected
  L1tf:                      Not affected
  Mds:                       Not affected
  Meltdown:                  Not affected
  Mmio stale data:           Not affected
  Old microcode:             Not affected
  Reg file data sampling:    Not affected
  Retbleed:                  Not affected
  Spec rstack overflow:      Not affected
  Spec store bypass:         Mitigation; Speculative Store Bypass disabled via prctl
  Spectre v1:                Mitigation; usercopy/swapgs barriers and __user pointer sanitization
  Spectre v2:                Mitigation; Enhanced / Automatic IBRS; IBPB conditional; PBRSB-eIBRS SW sequence; BHI BHI_DIS_S
  Srbds:                     Not affected
  Tsa:                       Not affected
  Tsx async abort:           Not affected
  Vmscape:                   Mitigation; IBPB before exit to userspace
root@pve:~#
 
Thank you!
This seems to be exactly the issue I'm experiencing as well.

Do you think the issue is only related to the timeout or linked to other issues (e.g. the inotify error message in the log)?

Is there anything I can provide or help in order for the issue to get addressed in a somehow "timely" fashion?
 
Hi @broth-itk,
do you have IO thread enabled for your VM disks or not? Could you share the configuration of an affected VM, i.e. qm config ID with the numerical ID.
 
I have I/O threads enabled on all my servers.

This is the config of the VM from my report:

Code:
agent: 1
bios: ovmf
boot: order=scsi0;sata0
cores: 4
cpu: x86-64-v3
efidisk0: local-tank01:vm-103-disk-0,size=1M
machine: pc-i440fx-9.2+pve1
memory: 8192
meta: creation-qemu=9.2.0,ctime=1743197278
name: DC01
net0: virtio=00:0c:29:6c:de:4d,bridge=<redacted>
onboot: 1
ostype: win10
sata0: local:iso/virtio-win-0.1.285.iso,media=cdrom,size=771138K
scsi0: local-tank01:vm-103-disk-1,discard=on,iothread=1,size=120G,ssd=1
scsi1: local-tank01:vm-103-disk-2,discard=on,iothread=1,size=250G,ssd=1
scsihw: virtio-scsi-single
smbios1: uuid=564db081-cbac-058f-6d23-27b2d76cde4d
sockets: 1
startup: order=1
vga: qxl
vmgenid: fcbc7559-8b81-4215-804d-2cadeca848bc
 
  • Like
Reactions: fiona
@fiona thank you very much! I'm very happy to hear that you were able to reproduce the issue and to propose a fix!

From what I've read in the patch notes I'm confident that this will solve the issue.

BTW: Is the naming suspend vs. hibernate intentionally or just present for some historic/legacy reasons? Just wondering ;-)