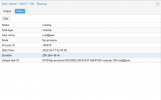
Backup hängt bei 99% und das über Stunden.

fsprogramming

New Member
Nov 12, 2022
14
0
1
Hallo zusammen,
Ich hoffe ihr könnt mir helfen.
Ich habe seit gut einer Woche das Problem, dass eine VM in meinem Proxmox sich nicht mehr richtig Sichern lässt.
Normal wird das Backup nachts gegen 02:00 Uhr durchgeführt. Wenn ich morgens in Proxmox rein schaue läuft das Backup der VM immer noch und steht bei 99%

1684261242550.png
Dabei ist es egal, ob die VM aus ist oder an bzw. welche Art ich vom Backup-Job nehme (Suspend, Snapshot, Stop) - Auch ist es egal ob ich das Backup auf eine Lokale Festplatte im Server oder auf meinen externen Proxmox Backupserver sichere.
Ich verzweifele langsam mit der VM. Alle anderen VMs lassen sich ohne Probleme Sichern.
 
Das Verhalten hatte ich auch schon, ist aber von selbst wieder verschwunden, daher leider keine Hilfe
 
Es gab einige Versionssprünge vom qemu-guest-agent, 7.x auf 8. Den mal updaten und die VM danach neu starten und nochmal probieren.
 
Hi,
bitte die Ausgabe von pveversion -v und qm config 100 und auch den Beginn vom Log posten. Welche Art von Storages werden für die Disken und als Backup-Ziel verwendet?

Wurden vor einer Woche irgendwelche Updates eingespielt, siehe /var/log/apt/history.log? Falls eines für pve-qemu-kvm dabei war, könntest Du mal versuchen auf die vorige Version downzugraden mit apt install pve-qemu-kvm=X.Y.Z-W wobei die Buchstaben mit der Version ersetzt werden müssen. Falls ein Kernel-Update dabei war, am besten auch mal versuchen, mit einem älteren Kernel zu booten.

EDIT: Ansonsten könntest Du auch mal mit dem dirty_ratio/dirty_bytes experimentieren, wie hier vorgeschlagen: https://bugzilla.proxmox.com/show_bug.cgi?id=2723#c24
 
Last edited:
Vollständige Ausgabe vom Backup, Frisch von dieser Nacht, läuft aktuell immer noch
Code:
INFO: starting new backup job: vzdump 100 --node fsp-proxmox --storage fsp_home --notes-template '{{guestname}}' --mailnotification always --mode snapshot --quiet 1
INFO: Starting Backup of VM 100 (qemu)
INFO: Backup started at 2023-05-17 02:00:00
INFO: status = running
INFO: VM Name: fs-srv-01
INFO: include disk 'scsi0' 'local-lvm:vm-100-disk-0' 250G
INFO: include disk 'scsi1' 'DATEN:vm-100-disk-0' 1224G
INFO: include disk 'scsi2' 'DATEN:vm-100-disk-1' 1224G
INFO: backup mode: snapshot
INFO: ionice priority: 7
INFO: creating Proxmox Backup Server archive 'vm/100/2023-05-17T00:00:00Z'
INFO: started backup task '4745f306-3425-403f-b42a-c060ad048a68'
INFO: resuming VM again
INFO: scsi0: dirty-bitmap status: created new
INFO: scsi1: dirty-bitmap status: created new
INFO: scsi2: dirty-bitmap status: created new
INFO:   0% (148.0 MiB of 2.6 TiB) in 3s, read: 49.3 MiB/s, write: 28.0 MiB/s
INFO:   1% (27.4 GiB of 2.6 TiB) in 29m 38s, read: 15.7 MiB/s, write: 8.0 MiB/s
INFO:   2% (56.2 GiB of 2.6 TiB) in 29m 49s, read: 2.6 GiB/s, write: 3.6 MiB/s
INFO:   3% (81.8 GiB of 2.6 TiB) in 30m 46s, read: 460.0 MiB/s, write: 10.0 MiB/s
INFO:   4% (108.1 GiB of 2.6 TiB) in 31m 1s, read: 1.7 GiB/s, write: 6.9 MiB/s
INFO:   5% (135.5 GiB of 2.6 TiB) in 31m 31s, read: 937.5 MiB/s, write: 9.1 MiB/s
INFO:   6% (161.9 GiB of 2.6 TiB) in 31m 41s, read: 2.6 GiB/s, write: 1.6 MiB/s
INFO:   7% (190.4 GiB of 2.6 TiB) in 31m 50s, read: 3.2 GiB/s, write: 0 B/s
INFO:   8% (217.7 GiB of 2.6 TiB) in 32m 2s, read: 2.3 GiB/s, write: 4.0 MiB/s
INFO:   9% (243.4 GiB of 2.6 TiB) in 32m 11s, read: 2.9 GiB/s, write: 1.8 MiB/s
INFO:  10% (270.9 GiB of 2.6 TiB) in 32m 19s, read: 3.4 GiB/s, write: 0 B/s
INFO:  11% (299.1 GiB of 2.6 TiB) in 32m 27s, read: 3.5 GiB/s, write: 0 B/s
INFO:  12% (324.5 GiB of 2.6 TiB) in 32m 35s, read: 3.2 GiB/s, write: 0 B/s
INFO:  13% (352.8 GiB of 2.6 TiB) in 32m 45s, read: 2.8 GiB/s, write: 0 B/s
INFO:  14% (379.9 GiB of 2.6 TiB) in 32m 54s, read: 3.0 GiB/s, write: 0 B/s
INFO:  15% (407.1 GiB of 2.6 TiB) in 33m 3s, read: 3.0 GiB/s, write: 0 B/s
INFO:  16% (433.8 GiB of 2.6 TiB) in 33m 12s, read: 3.0 GiB/s, write: 0 B/s
INFO:  17% (458.9 GiB of 2.6 TiB) in 33m 20s, read: 3.1 GiB/s, write: 0 B/s
INFO:  18% (486.8 GiB of 2.6 TiB) in 33m 29s, read: 3.1 GiB/s, write: 0 B/s
INFO:  19% (515.9 GiB of 2.6 TiB) in 33m 37s, read: 3.6 GiB/s, write: 0 B/s
INFO:  20% (540.2 GiB of 2.6 TiB) in 33m 45s, read: 3.0 GiB/s, write: 0 B/s
INFO:  21% (568.1 GiB of 2.6 TiB) in 33m 55s, read: 2.8 GiB/s, write: 0 B/s
INFO:  22% (593.9 GiB of 2.6 TiB) in 34m 4s, read: 2.9 GiB/s, write: 0 B/s
INFO:  23% (621.2 GiB of 2.6 TiB) in 34m 14s, read: 2.7 GiB/s, write: 0 B/s
INFO:  24% (648.4 GiB of 2.6 TiB) in 34m 24s, read: 2.7 GiB/s, write: 0 B/s
INFO:  25% (677.3 GiB of 2.6 TiB) in 34m 34s, read: 2.9 GiB/s, write: 0 B/s
INFO:  26% (704.4 GiB of 2.6 TiB) in 34m 43s, read: 3.0 GiB/s, write: 0 B/s
INFO:  27% (730.6 GiB of 2.6 TiB) in 34m 52s, read: 2.9 GiB/s, write: 0 B/s
INFO:  28% (756.0 GiB of 2.6 TiB) in 35m 2s, read: 2.5 GiB/s, write: 0 B/s
INFO:  29% (783.0 GiB of 2.6 TiB) in 35m 12s, read: 2.7 GiB/s, write: 0 B/s
INFO:  30% (811.4 GiB of 2.6 TiB) in 35m 23s, read: 2.6 GiB/s, write: 372.4 KiB/s
INFO:  31% (837.1 GiB of 2.6 TiB) in 35m 33s, read: 2.6 GiB/s, write: 0 B/s
INFO:  32% (866.0 GiB of 2.6 TiB) in 35m 44s, read: 2.6 GiB/s, write: 0 B/s
INFO:  33% (891.6 GiB of 2.6 TiB) in 35m 54s, read: 2.6 GiB/s, write: 0 B/s
INFO:  34% (917.6 GiB of 2.6 TiB) in 36m 5s, read: 2.4 GiB/s, write: 0 B/s
INFO:  35% (944.4 GiB of 2.6 TiB) in 36m 15s, read: 2.7 GiB/s, write: 0 B/s
INFO:  36% (971.6 GiB of 2.6 TiB) in 36m 24s, read: 3.0 GiB/s, write: 0 B/s
INFO:  37% (999.7 GiB of 2.6 TiB) in 36m 33s, read: 3.1 GiB/s, write: 0 B/s
INFO:  38% (1.0 TiB of 2.6 TiB) in 36m 42s, read: 3.1 GiB/s, write: 0 B/s
INFO:  39% (1.0 TiB of 2.6 TiB) in 37m 14s, read: 818.1 MiB/s, write: 50.5 MiB/s
INFO:  40% (1.1 TiB of 2.6 TiB) in 37m 42s, read: 1016.6 MiB/s, write: 30.9 MiB/s
INFO:  41% (1.1 TiB of 2.6 TiB) in 38m, read: 1.4 GiB/s, write: 41.6 MiB/s
INFO:  42% (1.1 TiB of 2.6 TiB) in 38m 34s, read: 833.2 MiB/s, write: 26.0 MiB/s
INFO:  43% (1.1 TiB of 2.6 TiB) in 38m 57s, read: 1.2 GiB/s, write: 35.1 MiB/s
INFO:  44% (1.2 TiB of 2.6 TiB) in 39m 24s, read: 1002.1 MiB/s, write: 31.7 MiB/s
INFO:  45% (1.2 TiB of 2.6 TiB) in 39m 43s, read: 1.5 GiB/s, write: 43.2 MiB/s
INFO:  46% (1.2 TiB of 2.6 TiB) in 40m 1s, read: 1.6 GiB/s, write: 22.7 MiB/s
INFO:  47% (1.2 TiB of 2.6 TiB) in 40m 9s, read: 3.0 GiB/s, write: 0 B/s
INFO:  48% (1.3 TiB of 2.6 TiB) in 40m 17s, read: 3.3 GiB/s, write: 0 B/s
INFO:  49% (1.3 TiB of 2.6 TiB) in 40m 26s, read: 3.3 GiB/s, write: 0 B/s
INFO:  50% (1.3 TiB of 2.6 TiB) in 40m 33s, read: 3.5 GiB/s, write: 0 B/s
INFO:  51% (1.3 TiB of 2.6 TiB) in 40m 41s, read: 3.3 GiB/s, write: 0 B/s
INFO:  52% (1.4 TiB of 2.6 TiB) in 40m 50s, read: 3.2 GiB/s, write: 0 B/s
INFO:  53% (1.4 TiB of 2.6 TiB) in 40m 58s, read: 3.5 GiB/s, write: 0 B/s
INFO:  54% (1.4 TiB of 2.6 TiB) in 41m 5s, read: 3.5 GiB/s, write: 0 B/s
INFO:  55% (1.5 TiB of 2.6 TiB) in 41m 14s, read: 3.1 GiB/s, write: 0 B/s
INFO:  56% (1.5 TiB of 2.6 TiB) in 41m 24s, read: 2.8 GiB/s, write: 0 B/s
INFO:  57% (1.5 TiB of 2.6 TiB) in 41m 33s, read: 3.1 GiB/s, write: 910.2 KiB/s
INFO:  58% (1.5 TiB of 2.6 TiB) in 41m 40s, read: 3.4 GiB/s, write: 0 B/s
INFO:  59% (1.6 TiB of 2.6 TiB) in 41m 48s, read: 3.4 GiB/s, write: 0 B/s
INFO:  60% (1.6 TiB of 2.6 TiB) in 41m 56s, read: 3.4 GiB/s, write: 0 B/s
INFO:  61% (1.6 TiB of 2.6 TiB) in 42m 4s, read: 3.3 GiB/s, write: 0 B/s
INFO:  62% (1.6 TiB of 2.6 TiB) in 42m 12s, read: 3.3 GiB/s, write: 0 B/s
INFO:  63% (1.7 TiB of 2.6 TiB) in 42m 21s, read: 3.1 GiB/s, write: 0 B/s
INFO:  64% (1.7 TiB of 2.6 TiB) in 42m 30s, read: 3.2 GiB/s, write: 455.1 KiB/s
INFO:  65% (1.7 TiB of 2.6 TiB) in 42m 37s, read: 3.4 GiB/s, write: 0 B/s
INFO:  66% (1.7 TiB of 2.6 TiB) in 42m 45s, read: 3.4 GiB/s, write: 0 B/s
INFO:  67% (1.8 TiB of 2.6 TiB) in 42m 53s, read: 3.5 GiB/s, write: 0 B/s
INFO:  68% (1.8 TiB of 2.6 TiB) in 43m 2s, read: 3.2 GiB/s, write: 910.2 KiB/s
INFO:  69% (1.8 TiB of 2.6 TiB) in 43m 12s, read: 2.5 GiB/s, write: 1.6 MiB/s
INFO:  70% (1.8 TiB of 2.6 TiB) in 43m 23s, read: 2.6 GiB/s, write: 0 B/s
INFO:  71% (1.9 TiB of 2.6 TiB) in 43m 33s, read: 2.7 GiB/s, write: 0 B/s
INFO:  72% (1.9 TiB of 2.6 TiB) in 43m 43s, read: 2.6 GiB/s, write: 0 B/s
INFO:  73% (1.9 TiB of 2.6 TiB) in 43m 53s, read: 2.8 GiB/s, write: 0 B/s
INFO:  74% (2.0 TiB of 2.6 TiB) in 44m 3s, read: 2.6 GiB/s, write: 0 B/s
INFO:  75% (2.0 TiB of 2.6 TiB) in 44m 14s, read: 2.6 GiB/s, write: 372.4 KiB/s
INFO:  76% (2.0 TiB of 2.6 TiB) in 44m 24s, read: 2.7 GiB/s, write: 0 B/s
INFO:  77% (2.0 TiB of 2.6 TiB) in 44m 34s, read: 2.7 GiB/s, write: 0 B/s
INFO:  78% (2.1 TiB of 2.6 TiB) in 44m 44s, read: 2.6 GiB/s, write: 0 B/s
INFO:  79% (2.1 TiB of 2.6 TiB) in 44m 54s, read: 2.6 GiB/s, write: 409.6 KiB/s
INFO:  80% (2.1 TiB of 2.6 TiB) in 45m 4s, read: 2.8 GiB/s, write: 0 B/s
INFO:  81% (2.1 TiB of 2.6 TiB) in 45m 15s, read: 2.6 GiB/s, write: 372.4 KiB/s
INFO:  82% (2.2 TiB of 2.6 TiB) in 45m 25s, read: 2.7 GiB/s, write: 0 B/s
INFO:  83% (2.2 TiB of 2.6 TiB) in 45m 36s, read: 2.5 GiB/s, write: 372.4 KiB/s
INFO:  84% (2.2 TiB of 2.6 TiB) in 45m 46s, read: 2.7 GiB/s, write: 0 B/s
INFO:  85% (2.2 TiB of 2.6 TiB) in 45m 56s, read: 2.7 GiB/s, write: 0 B/s
INFO:  86% (2.3 TiB of 2.6 TiB) in 46m 6s, read: 2.8 GiB/s, write: 0 B/s
INFO:  87% (2.3 TiB of 2.6 TiB) in 46m 16s, read: 2.5 GiB/s, write: 0 B/s
INFO:  88% (2.3 TiB of 2.6 TiB) in 46m 27s, read: 2.6 GiB/s, write: 0 B/s
INFO:  89% (2.3 TiB of 2.6 TiB) in 46m 37s, read: 2.6 GiB/s, write: 0 B/s
INFO:  90% (2.4 TiB of 2.6 TiB) in 46m 48s, read: 2.6 GiB/s, write: 0 B/s
INFO:  91% (2.4 TiB of 2.6 TiB) in 53m 41s, read: 61.5 MiB/s, write: 9.2 MiB/s
INFO:  92% (2.4 TiB of 2.6 TiB) in 1h 51m 30s, read: 8.0 MiB/s, write: 7.9 MiB/s
INFO:  93% (2.5 TiB of 2.6 TiB) in 2h 7m 59s, read: 28.2 MiB/s, write: 6.3 MiB/s
INFO:  94% (2.5 TiB of 2.6 TiB) in 2h 8m 8s, read: 3.1 GiB/s, write: 0 B/s
INFO:  95% (2.5 TiB of 2.6 TiB) in 2h 8m 17s, read: 3.1 GiB/s, write: 0 B/s
INFO:  96% (2.5 TiB of 2.6 TiB) in 2h 8m 26s, read: 3.0 GiB/s, write: 0 B/s
INFO:  97% (2.6 TiB of 2.6 TiB) in 2h 8m 36s, read: 2.7 GiB/s, write: 0 B/s
INFO:  98% (2.6 TiB of 2.6 TiB) in 2h 8m 44s, read: 3.3 GiB/s, write: 0 B/s
INFO:  99% (2.6 TiB of 2.6 TiB) in 2h 8m 52s, read: 3.3 GiB/s, write: 0 B/s
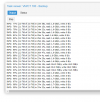
1684355758058.png


Aufgabe von pveversion -v

Code:
proxmox-ve: 7.4-1 (running kernel: 5.15.107-2-pve)
pve-manager: 7.4-3 (running version: 7.4-3/9002ab8a)
pve-kernel-5.15: 7.4-3
pve-kernel-5.15.107-2-pve: 5.15.107-2
pve-kernel-5.15.83-1-pve: 5.15.83-1
pve-kernel-5.15.74-1-pve: 5.15.74-1
ceph-fuse: 15.2.17-pve1
corosync: 3.1.7-pve1
criu: 3.15-1+pve-1
glusterfs-client: 9.2-1
ifupdown2: 3.1.0-1+pmx3
ksm-control-daemon: 1.4-1
libjs-extjs: 7.0.0-1
libknet1: 1.24-pve2
libproxmox-acme-perl: 1.4.4
libproxmox-backup-qemu0: 1.3.1-1
libproxmox-rs-perl: 0.2.1
libpve-access-control: 7.4-2
libpve-apiclient-perl: 3.2-1
libpve-common-perl: 7.4-1
libpve-guest-common-perl: 4.2-4
libpve-http-server-perl: 4.2-3
libpve-rs-perl: 0.7.6
libpve-storage-perl: 7.4-2
libspice-server1: 0.14.3-2.1
lvm2: 2.03.11-2.1
lxc-pve: 5.0.2-2
lxcfs: 5.0.3-pve1
novnc-pve: 1.4.0-1
proxmox-backup-client: 2.4.1-1
proxmox-backup-file-restore: 2.4.1-1
proxmox-kernel-helper: 7.4-1
proxmox-mail-forward: 0.1.1-1
proxmox-mini-journalreader: 1.3-1
proxmox-widget-toolkit: 3.6.5
pve-cluster: 7.3-3
pve-container: 4.4-3
pve-docs: 7.4-2
pve-edk2-firmware: 3.20230228-2
pve-firewall: 4.3-1
pve-firmware: 3.6-5
pve-ha-manager: 3.6.1
pve-i18n: 2.12-1
pve-qemu-kvm: 7.2.0-8
pve-xtermjs: 4.16.0-1
qemu-server: 7.4-3
smartmontools: 7.2-pve3
spiceterm: 3.2-2
swtpm: 0.8.0~bpo11+3
vncterm: 1.7-1
zfsutils-linux: 2.1.11-pve1

Und qm config 100
Code:
agent: 0
boot:
cores: 8
hotplug: disk,network,usb
ide2: local:iso/virtio-win-0.1.229.iso,media=cdrom,size=522284K
lock: backup
machine: pc-q35-5.1
memory: 16384
meta: creation-qemu=7.1.0,ctime=1674765608
name: fs-srv-01
net0: e1000=AE:A7:7C:D1:E5:FE,bridge=vmbr0,firewall=1
numa: 0
onboot: 1
ostype: win10
scsi0: local-lvm:vm-100-disk-0,size=250G
scsi1: DATEN:vm-100-disk-0,size=1224G
scsi2: DATEN:vm-100-disk-1,size=1224G
scsihw: virtio-scsi-pci
smbios1: uuid=2133618f-2211-4884-9ae6-afa1399d2d32
sockets: 2
vmgenid: 5f386487-a4fd-4630-a96b-0d1591fb957e

Updates habe ich gestern morgen gemacht. Das Problem besteht aber tatsächlich schon seit dem 25.04
Ich hatte die Hoffnung das mit den Updates das Problem verschwindet, leider nicht.


Die Disks liegen einmal auf local-lvm und einmal auf DATEN.
Backups werden auf einem Proxmox-Backupserver gemacht. Dort läuft noch ein zweiter Server mit drauf, dieser hat keine Probleme, weswegen ich den Backup-Server ausschließen würde.

1684356062267.png

Das ist auch nur die VM100 die nicht durchläuft. VM101 und 102 funktionieren ohne Probleme
 
Last edited:
Läuft der Qemu-Guest Agent und ist er in der Konfiguration aktiviert? Hast du ihn vom Proxmox Server aus einmal gepingt? Passt die Kommunikation?

qm agent <vmid> ping
 
Das sollte aber funktionieren. Schau bitte hier - - > https://pve.proxmox.com/wiki/Qemu-guest-agent
Also der QEMU Agent läuft auf dem Server.
1684365032595.png
Ich habe auch keine unbekannten Geräte im Gerätemanager.
Trotzdem sagt der Ping das der Agent nicht läuft

EDIT:
Nachdem ich nun den Guest Agent zwei mal Neuinstalliert habe ist er auch Pingbar und im Proxmox zeigt er mir entsprechend die IPs der VM an.
 
Last edited:
Es ist zwar empfohlen den Guest Agent zu installieren, für bessere Konsistenz, aber ein deaktivierter Guest Agent kann nicht dazu führen, dass das Backup hängt. Das muss einen anderen Grund haben.

Updates habe ich gestern morgen gemacht. Das Problem besteht aber tatsächlich schon seit dem 25.04
Ich hatte die Hoffnung das mit den Updates das Problem verschwindet, leider nicht.
Wurde damals Updates eingespielt? Siehe /var/log/apt/history.log oder /var/log/apt/history.log.1 etc.

Das ist auch nur die VM100 die nicht durchläuft. VM101 und 102 funktionieren ohne Probleme
Benutzen diese auch die selben Storages?

Was zeigt der Task-Log am Backup Server? Gibt es irgendwas in /var/log/syslog, sowohl auf Proxmox VE oder PBS-Seite?
 
Wurde damals Updates eingespielt? Siehe /var/log/apt/history.log oder /var/log/apt/history.log.1 etc.
In der history.log ist nur das Update was ich manuell angestoßen habe und eine weitere history.log.1-n etc. gibt es nicht.
Benutzen diese auch die selben Storages?
Ja und Nein, Die Hauptfestplatten liegen alle auf dem Local-LVM. Die anderen beiden VMs haben aber keine weitere Platte drin. Die Backups laufen alle auf den Backup-Server.

Was zeigt der Task-Log am Backup Server?
Hier scheint es tatsächlich einen Fehler zu geben, den ich aber so gerade nicht verstehe bzw. eine Lösung für habe,
Code:
2023-05-18T01:27:36+02:00: starting new backup on datastore 'fsp_home': "vm/100/2023-05-17T23:27:04Z"
2023-05-18T01:27:36+02:00: download 'index.json.blob' from previous backup.
2023-05-18T01:27:36+02:00: GET /previous: 400 Bad Request: Unable to open fixed index "/fsp_home/vm/100/2023-04-25T00:00:07Z/drive-scsi0.img.fidx" - No such file or directory (os error 2)
2023-05-18T01:27:36+02:00: created new fixed index 1 ("vm/100/2023-05-17T23:27:04Z/drive-scsi0.img.fidx")
2023-05-18T01:27:36+02:00: GET /previous: 400 Bad Request: Unable to open fixed index "/fsp_home/vm/100/2023-04-25T00:00:07Z/drive-scsi1.img.fidx" - No such file or directory (os error 2)
2023-05-18T01:27:36+02:00: created new fixed index 2 ("vm/100/2023-05-17T23:27:04Z/drive-scsi1.img.fidx")
2023-05-18T01:27:36+02:00: GET /previous: 400 Bad Request: Unable to open fixed index "/fsp_home/vm/100/2023-04-25T00:00:07Z/drive-scsi2.img.fidx" - No such file or directory (os error 2)
2023-05-18T01:27:36+02:00: created new fixed index 3 ("vm/100/2023-05-17T23:27:04Z/drive-scsi2.img.fidx")
2023-05-18T01:27:36+02:00: add blob "/fsp_home/vm/100/2023-05-17T23:27:04Z/qemu-server.conf.blob" (441 bytes, comp: 441)
 
In der history.log ist nur das Update was ich manuell angestoßen habe und eine weitere history.log.1-n etc. gibt es nicht.
Sind diese vielleicht gezipped, i.e. history.log.1.gz? Falls ja, kannst Du sie z.B. mit gunzip -c history.log.1.gz| less lesen.

Ja und Nein, Die Hauptfestplatten liegen alle auf dem Local-LVM. Die anderen beiden VMs haben aber keine weitere Platte drin. Die Backups laufen alle auf den Backup-Server.
Also könnte es mit der anderen Storage zu tun haben oder vielleicht auch damit, dass die Disk so groß ist.

Hier scheint es tatsächlich einen Fehler zu geben, den ich aber so gerade nicht verstehe bzw. eine Lösung für habe,
Code:
2023-05-18T01:27:36+02:00: starting new backup on datastore 'fsp_home': "vm/100/2023-05-17T23:27:04Z"
2023-05-18T01:27:36+02:00: download 'index.json.blob' from previous backup.
2023-05-18T01:27:36+02:00: GET /previous: 400 Bad Request: Unable to open fixed index "/fsp_home/vm/100/2023-04-25T00:00:07Z/drive-scsi0.img.fidx" - No such file or directory (os error 2)
2023-05-18T01:27:36+02:00: created new fixed index 1 ("vm/100/2023-05-17T23:27:04Z/drive-scsi0.img.fidx")
2023-05-18T01:27:36+02:00: GET /previous: 400 Bad Request: Unable to open fixed index "/fsp_home/vm/100/2023-04-25T00:00:07Z/drive-scsi1.img.fidx" - No such file or directory (os error 2)
2023-05-18T01:27:36+02:00: created new fixed index 2 ("vm/100/2023-05-17T23:27:04Z/drive-scsi1.img.fidx")
2023-05-18T01:27:36+02:00: GET /previous: 400 Bad Request: Unable to open fixed index "/fsp_home/vm/100/2023-04-25T00:00:07Z/drive-scsi2.img.fidx" - No such file or directory (os error 2)
2023-05-18T01:27:36+02:00: created new fixed index 3 ("vm/100/2023-05-17T23:27:04Z/drive-scsi2.img.fidx")
2023-05-18T01:27:36+02:00: add blob "/fsp_home/vm/100/2023-05-17T23:27:04Z/qemu-server.conf.blob" (441 bytes, comp: 441)
Hab's nicht genau kontrolliert, aber das könnte einfach sein, weil es kein voriges Backup gibt bzw. weil es nicht erfolgreich war. Und es passiert ganz am Anfang.

Könntest Du die Pakete apt install gdb pve-qemu-kvm-dbg libproxmox-backup-qemu0-dbgsym installieren und dann, sobald das Backup wieder hängt, gdb --batch --ex 't a a bt' -p $(cat /var/run/qemu-server/100.pid) ausführen? Wenn wir Glück haben, zeigt uns das, wo es hängt.
 
Sind diese vielleicht gezipped, i.e. history.log.1.gz? Falls ja, kannst Du sie z.B. mit gunzip -c history.log.1.gz| less lesen.
Ja die sind gezippt. Es gibt noch zwei Update Logs. Einmal vom 13.05 wo ich htop nach installiert habe und dann erst wieder vom 02.06.2023 also weit vor dem eigentlichen Problem.
Hab's nicht genau kontrolliert, aber das könnte einfach sein, weil es kein voriges Backup gibt bzw. weil es nicht erfolgreich war. Und es passiert ganz am Anfang.
Das Backup vom 25.04 war aber erfolgreich laut Backupserver. Ich habe dies auch auf Verdacht mal gelöscht. Dann zeigt mir die Log das Backup vom 24.04 an.
Könntest Du die Pakete apt install gdb pve-qemu-kvm-dbg libproxmox-backup-qemu0-dbgsym installieren und dann, sobald das Backup wieder hängt, gdb --batch --ex 't a a bt' -p $(cat /var/run/qemu-server/100.pid) ausführen? Wenn wir Glück haben, zeigt uns das, wo es hängt.
Ich versuche mal mein Glück.
Also könnte es mit der anderen Storage zu tun haben oder vielleicht auch damit, dass die Disk so groß ist.
Das Storage Daten ist ein Hardware Raid aus mehreren Platten, diese sind laut Controller auch alle in Ordnung. Was könnte denn daran falsch sein?
 
Könntest Du die Pakete apt install gdb pve-qemu-kvm-dbg libproxmox-backup-qemu0-dbgsym installieren und dann, sobald das Backup wieder hängt, gdb --batch --ex 't a a bt' -p $(cat /var/run/qemu-server/100.pid) ausführen? Wenn wir Glück haben, zeigt uns das, wo es hängt.
Nachdem das Backup jetzt wieder 8 Stunden läuft, habe ich mal den Befehl in die Konsole gehauen. Folgendes kam dabei rum:

Code:
Leider zu groß für den Beitrag. Habe es als Datei angehangen.
 

Attachments

  • console.log
    25.5 KB · Views: 4
Leider nichts offensichtliches. Noch eine Frage: die VM selbst läuft ohne Probleme weiter? Und der Befehl qm status 100 --verbose funktioniert auch ohne zu hängen?

EDIT: Könntest Du folgendes Skript ausführen? Also eine Datei query-backup.pl mit folgendem Inhalt erstellen:
Code:
#!/bin/perl

use strict;
use warnings;

use Data::Dumper;
$Data::Dumper::Sortkeys = 1;

use PVE::QemuServer::Monitor qw(mon_cmd);

my $vmid = shift or die "need to specify vmid\n";

my $res = eval { mon_cmd($vmid, 'query-backup'); };
warn $@ if $@;
print Dumper($res);
exit 0;
und dann mit perl query-backup.pl 100 ausführen. Während das Backup noch hängt.
 
Last edited:
Leider nichts offensichtliches. Noch eine Frage: die VM selbst läuft ohne Probleme weiter? Und der Befehl qm status 100 --verbose funktioniert auch ohne zu hängen?
Nein, die VM läuft leider nicht normal weiter, sondern hängt sich nach einiger Zeit ebenfalls auf. Da hilft dann meist nach abbrechen des Backups und freigeben via qm unlock nur ein STOP und wieder starten.
 
Was Du noch versuchen könntest, aber kann wirklich keine Garantie geben, dass es hilft:
Werde ich später mal probieren, lasse die VM gerade wieder Backup, so dass diese in ca. 2-4 Stunden hängen sollte.

Was ich jetzt so überall gelesen habe, ist dass qcow2 als Festplatten-Typ empfohlen wird. Das DATEN-Storage sowie der local-lvm sind beides lvm-thin Laufwerke wo ich ja nur raw platten anlegen kann. Könnte das eventuell auch eine Ursache sein?
Bei Filesystem-basierten Storages wird qcow2 empfohlen, weil es weit mehr Features hat als raw, z.B. Snapshots. Aber LVM-Thin hat auf dem Storage-Layer Snapshots, also ist es nicht schlimm, wenn es raw ist. Es könnte schon sein, dass bestimmte Kombinationen von Kernel-Version+Storage-Typ+Async IO io_uring Probleme machen, deswegen mein Vorschlag. Gab es in der Vergangenheit, aber mit thick LVM und kenne im Moment keine ähnlichen Reports wie deinen, deshalb ist es nur geraten :)
 
und dann mit perl query-backup.pl 100 ausführen. Während das Backup noch hängt.
Also das Backup läuft jetzt seit 4 Stunden. Vor 2 Stunden wurde Status 99% erreicht.

Das ist die Ausgabe von Query_Backup.pl:


Code:
$VAR1 = {
          'backup-file' => 'root@pam@HOST.URL.DE:fsp_home',
          'dirty' => '2896955441152',
          'finishing' => bless( do{\(my $o = 0)}, 'JSON::PP::Boolean' ),
          'reused' => '2833722114048',
          'start-time' => 1684827273,
          'status' => 'active',
          'total' => '2896955441152',
          'transferred' => '2896951246848',
          'uuid' => '7b9eef42-8795-4cbb-9a33-8cf075e54741',
          'zero-bytes' => '2833646616576'
        };
 
Last edited:

About

The Proxmox community has been around for many years and offers help and support for Proxmox VE, Proxmox Backup Server, and Proxmox Mail Gateway.
We think our community is one of the best thanks to people like you!

Get your subscription!

The Proxmox team works very hard to make sure you are running the best software and getting stable updates and security enhancements, as well as quick enterprise support. Tens of thousands of happy customers have a Proxmox subscription. Get yours easily in our online shop.

Buy now!