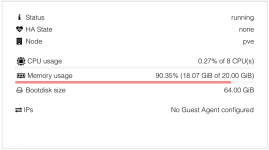
Proxmox VE rocks, except for this one thing, the memory usage graph.

jpop

Member
Aug 30, 2022
26
4
8
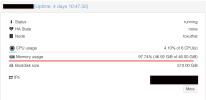
We have a couple of pretty beefy VM hosts running the latest VE and have on one host a fairly beefy VM because it is running a Mastodon server with 200 active accounts on it. However, the displayed memory usage in the Proxmox VE dashboard for this VM always shows 97% and higher memory utilization when it isn't being utilized like what is being displayed. A lot of the memory used is cached (we are still working on this part), but even when we clear the cache from time to time, the UI dashboard always shows memory max at 97% or higher.
  1. Are there any tips for standard Ubuntu VM's running a service with 200 active accounts that would assist in our goal of better memory management?
  2. Would this by chance be a known issue with the Proxmox dashboard?
Ultimately, we would expect the memory usage graph to show activity like the cpu usage graph does.

Screenshot 2024-06-22 at 10.19.42 AM.png
 
Any reason you cant use some sort of monitoring for the VM itself?

While the "at a glance view" from PVE is great - you probably need some sort of real VM monitoring.... that would monitor the actual VM and probably provide additional useful data.

Datadog, Dyntrace for some very good paid options - abit expensive.

Observium, Netdata, Zabbix etc for "Free" options but might require some more setup/configuration.

There are a lot of decent options these days.
 
A lot of the memory used is cached (we are still working on this part), but even when we clear the cache from time to time, the UI dashboard always shows memory max at 97% or higher.
Cache is good and per unix-definition used, so the graph the PVE shows is correct. Clearing cache is the same as deleting files on a filesystem, will not overwrite it with zero so that it is actually not free, just marked as free. Clearing cache is also a very, very bad thing to do. You will want to use all memory of a system and if you still have a lot of free memory after several days of uptime, then your VM has too much memory and you should reduce it.
 
  • Like
Reactions: Johannes S
Cache is good and per unix-definition used, so the graph the PVE shows is correct. Clearing cache is the same as deleting files on a filesystem, will not overwrite it with zero so that it is actually not free, just marked as free. Clearing cache is also a very, very bad thing to do. You will want to use all memory of a system and if you still have a lot of free memory after several days of uptime, then your VM has too much memory and you should reduce it.
The problem is that we have given this one VM half of the available RAM on the host and it keeps caching it all. This Mastodon service is a monster when it comes to memory usage. None of my other VMs do this. Why only this one?
 
The problem is that we have given this one VM half of the available RAM on the host and it keeps caching it all. This Mastodon service is a monster when it comes to memory usage. None of my other VMs do this. Why only this one?
Any VM that reads/writes a lot of files will grow the cache over time. This is not a problem, it is a benefit. See https://www.linuxatemyram.com/ for info. If you don't want Mastodon to eat all of your RAM in this way, give it less memory. You very much can't count on VM's using less than you give them. See the link for why.

Also, any VM that uses PCI passthrough will pre-allocate all RAM to avoid possible issues with DMA. Probably not an issue here but something to keep in mind.
 
I’ve noticed a recurring pattern in these forums where valid concerns or observations are often brushed off, dismissed, or met with unsolicited alternative solutions, even when it's clear that the underlying functionality could benefit from improvement.

Specifically, I believe the memory graph should accurately reflect actual usage.

For example, on a VM I’m currently working with, the free -h command outputs the following:
Bash:
               total        used        free      shared  buff/cache   available
Mem:            19Gi       1.1Gi       1.8Gi       1.3Mi        17Gi        18Gi
Swap:          7.9Gi          0B       7.9Gi


At this moment, no services are running on the server—all services have been shut down—yet the UI shows the following:
1736700084207.png

When someone raises the point that this representation is confusing, and suggests an alternative way of displaying memory usage, I believe that we owe it to them to engage with their perspective. Instead of dismissing their feedback or suggesting that they adopt a comprehensive monitoring solution, which in this case stood in the way of seeing the validity of their observation and discussing ways the functionality might be improved.

I would personally propose to have a patch to address this issue and engage with the Proxmox developers to find something that meets the desire of the community and also makes sense for the Proxmox team.
 
Specifically, I believe the memory graph should accurately reflect actual usage.
It actually does, that's the whole point what most people (posting such requests as yours) are NOT understanding correctly and get answers like mine now.

The graph shows the memory usage of the KVM process and that matches your output of free, which clearly states a memory usage of 18 GiB, as you can see by adding up used, shared and buff/cache yielding (surprise) 18 GiB. That is how memory works, always has.

PVE cannot display the buffer cache as free, because from its perspective, it is not free, it is used. If you really want acurate graphs, monitor the usage from the inside, a hypervisor cannot do that properly.

It is crucial to understand that memory usage graph on the hypervisor and in the VM do not match. They cannot and will not match, because they see things differently. Both are important but serve different goals, so reducing them to one is just wrong. Get proper external monitoring of your VMs.
 
PVE cannot display the buffer cache as free, because from its perspective, it is not free, it is used. If you really want acurate graphs, monitor the usage from the inside, a hypervisor cannot do that properly.

Thank you for this. It is true. Yet, from a user standpoint, it would make more sense to display the buffer cache as free. Failing to acknowledge this, in my opinion, can come across (and indeed does come across) as dismissing user input.
 
"From a user standpoint"? What user? A user inside the VM or the person managing PVE? That is what @LnxBil is saying. There are different constituencies that necessarily have different views and the numbers are intended for different purposes.

From the point of view of the PVE-manager the 18 GB figure is the correct one, because that is how much the VM consumes. Regardless of what it is used for inside the VM it is not available to other VM's or to the host and that is what matters when you are allocating resources. This VM has used X percent of my RAM and therefore I have that much less to allocate to others.

As for as the VM's view, that is also correct for the OS inside the VM when it makes decisions like whether to swap or kill a process. You seem to believe that this view is somehow more "correct" in some global sense. But displaying it as "the truth" would be misleading for purposes of allocating hypervisor resources. Eventually you'd be here complaining that the OOM-killer keeps killing VM's that have plenty of free memory.

An argument could be made that there should be two separate graphs. One showing PVE's view and one showing the VM view. That would help the PVE manager make decisions like "this VM has a huge disk cache it doesn't really need" and reduce the allocation to that VM.

Since there isn't such a graph (yet), the best you can do is monitor internally inside the VM using separate software.

ETA: Asking for the graph to be changed is barking up the wrong tree. You should perhaps be asking for a new presentation showing what's going on inside the VM. But since guest operating systems are all over the map in how they report usage, some don't even support the qemu-tools, this isn't trivial to do in the general case such that the information is presented in a consistent way.
 
Last edited:
"From a user standpoint"? What user? A user inside the VM or the person managing PVE? That is what @LnxBil is saying. There are different constituencies that necessarily have different views and the numbers are intended for different purposes.

One user here, who is both: I don't want anything to change. A new view I could live with but it's not really needed if one set up monitoring inside the VM which is something one should do anyway.
An argument could be made that there should be two separate graphs. One showing PVE's view and one showing the VM view. That would help the PVE manager make decisions like "this VM has a huge disk cache it doesn't really need" and reduce the allocation to that VM.

This would need sufficent support on the guest OS though. Qemu utils and co are not always possible.

Since there isn't such a graph (yet), the best you can do is monitor internally inside the VM using separate software.

And in a corparate environment one would need to do this anyway. Sorry to be blunt: For me this looks like a typical homelab request, the problem behind it should never be an issue in a professional administrated environment.
ETA: Asking for the graph to be changed is barking up the wrong tree. You should perhaps be asking for a new presentation showing what's going on inside the VM. But since guest operating systems are all over the map in how they report usage, some don't even support the qemu-tools, this isn't trivial to do in the general case such that the information is presented in a consistent way.
This, for this reason it's not so easy to develop something for it. To be honest I would consider such a function even harmful in case some wrong data is displayed due to missing guest os support.
Thank you for this. It is true. Yet, from a user standpoint, it would make more sense to display the buffer cache as free. Failing to acknowledge this, in my opinion, can come across (and indeed does come across) as dismissing user input.
I'm a user myself, not a developer. LnxBil and BobWasatch are also users of ProxmoxVE, not developers. Does this mean, that you are dismissing user input,?
On a more serious note: PVE is open source you are free to create a patch and submit it to the developers or provide your own forked version or "hellish script" to change the memory view in the proposed way.
 
And in a corparate environment one would need to do this anyway. Sorry to be blunt: For me this looks like a typical homelab request, the problem behind it should never be an issue in a professional administrated environment.

Thank you for this. You are right, it is a request from someone who manages cloud solutions end-to-end, and who does not consider with is inside the VM "someone else's problem".

Reading everything that has been posted, I think I understand things better now. However, I still think that this is an invitation to engage, rather than to dismiss, the other perspective (call it a "homelab'er" perspective).

I have a question to the professional users in this thread: Since in my case, 20GB of RAM have already been allocated to the VM in question, and likely are being paid for by the "VM user", why does the "PVE-manager" care if the VM is internally utilising, say 20%, or 80%, of its allocated memory in a professional setting?

I am just trying to understand how the current memory graph helps a PVE manager who is a professional user of Proxmox (since I already know, that this memory graph is not useful for another category of users).
 
Asked differently, will there be actual harm caused to the professional users represented by those replying to me in this thread if the memory usage and graphs were entirely removed from the VM Summary in Proxmox?
 
Memory graphs like that haven't been useful for a long time in both Linux and Windows, any modern OS will eat up any available memory (and why not, you paid for it, might as well get a boost from it). You can use memory ballooning to overcommit guests and when you need the memory, that will reduce that cache a bit.

There are tweaks and knobs in the OS to not cache your (virtual) disk as much, but then applications may still eat it, Microsoft has some online documentation about disabling it for VDI, Linux you can find knobs (look for dirty centisecs in sysctl for the write cache, pagecache for the read cache) as well, eg, set it to 10% of your memory if you really need the memory to be accurate AND you do caching at another level already (eg. Ceph).

If you want to follow a specific memory type in your particular OS/application (note there are semantic differences between 'cache' on various OS), you'll have to use something more detailed like Prometheus. Yes, in most cases it is disk cache, but database systems also have cache/buffer and ZFS has a slightly different definition of what that means, but it all shows up as buffer in Linux and BSD and other OS may have slightly different names or functions as well, so it would be hard for a hypervisor to give 'details'.
 
Last edited:
Im an administator for 7 VMware ESXi environments atm (so no homelabber) and I very much like to have a good info how much RAM a host has AVAILABLE.
Look at the "free -h" command earlier in this thread: You can clearly see that 18 / 19 GiB are "available" for processes to be used. If I had that information I'd know that I can migrate another VM here with a current RAM usage of 16 GiB. Of course the host would have use reduce the amount files cached which would make everything else a little bit slower (by how much we can argue), but this much ram is AVAILABLE for processes (according to "free").
If the host displays "98%" full, I'd have to assume I cant migrate this VM here - because I'd run into OOM and the host would start killing crucial processes.
Is that an unreasonable use case? Just a homelab thing? Why?
See https://www.linuxatemyram.com/ for explanations what "available" means.
 
Last edited:
  • Like
Reactions: orwadira
Yes, it is unreasonable to assume your guest can just reduce it cache without any effect on the OS. You would need to make sure memory ballooning is available and working to pressure the cache out of memory. At this point, you don't ACTUALLY have the memory available. You may request the guest to flush some caches, but if it's not going to for whatever reason (it refuses, it is broken etc) you can't reduce the memory.

Again, something like Prometheus will tell you more details why and you can tune your guests to use less page cache, WHETHER it is a good idea is entirely up to you. I wouldn't want my MySQL and Tomcat servers to suddenly flush their caches and start doing slow IO instead just because some knucklehead sysadmin assumed that 'free' and 'available/cached/buffered' all meant 'free to use'. If VMware indicates that as free through its tooling, it is wrong, I understand you may run into a cost issue if you need more VMware licenses and you'd rather overcommit significantly, that is a value judgment for the business.

You have to understand the reason behind your caches, it may be entirely reasonable to say for a desktop, most of it is never hit, it's just there, you can tune your OS to flush anything that hasn't been used in 60s. But you can't make that assumption broadly for all applications.
 
Last edited:
Im an administator for 7 VMware ESXi environments atm (so no homelabber) and I very much like to have a good info how much RAM a host has AVAILABLE.
Look at the "free -h" command earlier in this thread: You can clearly see that 18 / 19 GiB are "available" for processes to be used. If I had that information I'd know that I can migrate another VM here with a current RAM usage of 16 GiB.
That info is from inside the VM in this discussion, not from the hypervisor. As such it is irrelevant to the question of whether there is enough RAM to support another VM. For that you need to know the hypervisor's view of things, which is what the graph on the PVE dashboard shows.

The Linux At My RAM link isn't wrong, but you have to remember that it applies to both the VM and to the hypervisor. The intent of it is to explain why a busy Linux machine will eventually use all RAM for something.

Of course the host would have use reduce the amount files cached which would make everything else a little bit slower (by how much we can argue), but this much ram is AVAILABLE for processes (according to "free").
It is "available for processes" IN THAT VM. It is NOT available to the hypervisor to give to another VM. We are not talking containers here, we are talking virtual machines. Containers are more like "processes" to the hypervisor whereas virtual machines are self-contained with their own OS.

Now, knowing that so much RAM is used for disk cache in that VM might lead you to reduce its RAM allocation so the hypervisor can use the memory elsewhere. But the fact that it is "available" inside the VM doesn't mean that the hypervisor can just give it to another VM. It must be taken away somehow first, either through manual administrator action or through something like the balloon mechanism.

Some hypervisors, Hyper-V for example, can set min and max memory for a VM and have it dynamically allocated based on the VM's own activity. After startup, memory is reduced to them minimum until the VM asks for more. This only works for guests that support the Hyper-V equivalent of the guest-tools. And it impacts performance when active.

PVE currently does not have that feature. The "balloon" feature does allow the hypervisor to take memory from the VM when the system as a whole is under memory pressure, but it doesn't work like Hyper-V in that regard. The VM will get its maximum until the system needs the memory. And again, this only works if the guest supports the guest-tools and it can impact performance.
 
Last edited:
That info is from inside the VM in this discussion, not from the hypervisor. As such it is irrelevant to the question of whether there is enough RAM to support another VM. For that you need to know the hypervisor's view of things, which is what the graph on the PVE dashboard shows.
Sorry you are correct, this was indeed a screenshot from the VM and not from the host. Looking at my test installation it seems like the host shows available RAM in the host graph. So everything is fine on my end.

Sorry for the derailment!
 
Asked differently, will there be actual harm caused to the professional users represented by those replying to me in this thread if the memory usage and graphs were entirely removed from the VM Summary in Proxmox?
The question is: What's the benefit that development effort should be spent on this although professional users won't need it? I prefer developers effort is spent on features which might convince my employer to switch their vmware cluster to ProxmoxVE with support subscription instead of appeasing the homelab crowd which won't pay for further development anyhow.
 
Last edited:
  • Like
Reactions: cfgmgr and LnxBil
The question is: What's the benefit that development effort should be spent on this although professional users won't need it? I prefer developers effort is spent on features which might convince my employer to switch their vmware cluster to ProxmoxVE with support subscription instead of appeasing the homelab crowd which won't pay for further development anyhow.

We are all users, regardless of whether we pay a subscription, or not. Business users are not first-class citizens and homelaber's are not 2nd-class citizens. What some users do not offer in terms of monetary support to the Proxmox project, they make up in volumes in terms of patches being sent and documentation/content being created (as most of Proxmox's wide reach is indeed created by the vast amount of content created for it, mostly by homelab'ers).

I hence wholeheartedly invite you to reconsider this logic. We are all users and we must be able to consolidate and litigate issues taking our combined interest into mind. Not only that this dichotomy of users unethical, it is also inaccurate, as many people started as homelab'ers before they upgraded their use to start making money off Proxmox.

Im an administator for 7 VMware ESXi environments atm (so no homelabber) and I very much like to have a good info how much RAM a host has AVAILABLE.
Look at the "free -h" command earlier in this thread: You can clearly see that 18 / 19 GiB are "available" for processes to be used. If I had that information I'd know that I can migrate another VM here with a current RAM usage of 16 GiB. Of course the host would have use reduce the amount files cached which would make everything else a little bit slower (by how much we can argue), but this much ram is AVAILABLE for processes (according to "free").
If the host displays "98%" full, I'd have to assume I cant migrate this VM here - because I'd run into OOM and the host would start killing crucial processes.
Is that an unreasonable use case? Just a homelab thing? Why?
See https://www.linuxatemyram.com/ for explanations what "available" means.

I wholeheartedly agree with this definition of what free means. Regardless of what is right to do. Failing to engage and acknowledge this simple perspective to me seems to speak of a problem in our community, which is manifesting in this thread.

Some people are clearly prepared to go to incredible lengths to convince everyone that since the VM is using a great part of this RAM for caching, and since not allowing it to use as much cache would effect its function, then this amount of cache is "used memory", and hence, it is "unavailable memory". We disagree. Many people disagree (https://www.linuxatemyram.com/). Please acknowledge that this is not a universal point of view.

At the very least, someone can argue that the red color of the RAM utilisation bar indicator in the VM summary is misleading:
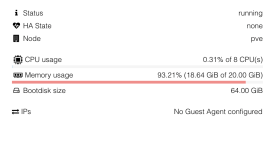
1736932423239.png

In the UI view above, red seems to suggest that an action is needed. NOTHING can be further from the truth. In fact, this VM's RAM can be reduced to 4GB and it would perform similarly.

Now that we know that it is misleading, we will start ignoring it, in favour of an internal probing method, but then, what use is this RAM utilisation bar indicator? maybe the right solution would be to remove it entirely.

I did not know what ballooning is until I did some reading. As far as I understood, this is an optional feature that requires an agent running inside the VM which is disabled by default.

Refusing to acknowledge the quite-valid perspective of many people here is a blocker of innovation because it is preventing us from thinking of simple ways to deal with this misleading UI problem. Indeed, there might be very simple fixes but to be able to figure them out, we need to agree that the current situation can benefit from some improvement.

I also think that when someone's point of view is acknowledged, they feel more understood which leads to more constructive dialogue. At the end of the day, you might be paying a subscription and you might think that your use of Proxmox more legit but I doubt that you would be prepared to spend a week diving into Proxmox's source code to fix an issue, whereas many homelab'ers (hobby users) are prepared to do such a thing. So by seeing each other eye to eye and acknowledging each other's concerns not only you make someone feel better, but you will also create development resources that will help solve problems.
 
Last edited:
  • Like
Reactions: rayhanvarian