Hi All,
I have seen a number of post regarding Windows VM RAM usage, but none have seen to be able to answer my question.
ISSUE:
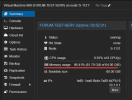
Whenever i clone or create a new Windows VM (We are using Windows Server 2022), the VM deploys but the RAM usage goes and stays at approx 95%,.
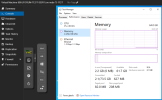
image 1 you can see this behaviour, the VM (999 FORUM-TEST-SERV) has been newly cloned, is turned on and is just running the OS in idle, it is currently on node S-797 and the RAM usage is at 93%
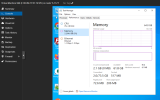
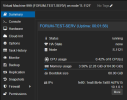
image 2/3 you can see that i have migrated the same VM to another node (S-1121) and the RAM usage has stabalised to what it should be (and what it is showing on the windows VM)
Migration details:
Migration is a live migration and the requested state is running.
I have seen a number of post regarding Windows VM RAM usage, but none have seen to be able to answer my question.
ISSUE:
Whenever i clone or create a new Windows VM (We are using Windows Server 2022), the VM deploys but the RAM usage goes and stays at approx 95%,.
image 1 you can see this behaviour, the VM (999 FORUM-TEST-SERV) has been newly cloned, is turned on and is just running the OS in idle, it is currently on node S-797 and the RAM usage is at 93%
image 2/3 you can see that i have migrated the same VM to another node (S-1121) and the RAM usage has stabalised to what it should be (and what it is showing on the windows VM)
Migration details:
Migration is a live migration and the requested state is running.
Code:
root@S-797:~# pveversion -v
proxmox-ve: 8.2.0 (running kernel: 6.8.12-3-pve)
pve-manager: 8.2.7 (running version: 8.2.7/3e0176e6bb2ade3b)
proxmox-kernel-helper: 8.1.0
proxmox-kernel-6.8: 6.8.12-3
proxmox-kernel-6.8.12-3-pve-signed: 6.8.12-3
proxmox-kernel-6.8.4-2-pve-signed: 6.8.4-2
ceph: 18.2.4-pve3
ceph-fuse: 18.2.4-pve3
corosync: 3.1.7-pve3
criu: 3.17.1-2
glusterfs-client: 10.3-5
ifupdown2: 3.2.0-1+pmx9
ksm-control-daemon: 1.5-1
libjs-extjs: 7.0.0-4
libknet1: 1.28-pve1
libproxmox-acme-perl: 1.5.1
libproxmox-backup-qemu0: 1.4.1
libproxmox-rs-perl: 0.3.4
libpve-access-control: 8.1.4
libpve-apiclient-perl: 3.3.2
libpve-cluster-api-perl: 8.0.8
libpve-cluster-perl: 8.0.8
libpve-common-perl: 8.2.5
libpve-guest-common-perl: 5.1.4
libpve-http-server-perl: 5.1.2
libpve-network-perl: 0.9.8
libpve-rs-perl: 0.8.10
libpve-storage-perl: 8.2.5
libspice-server1: 0.15.1-1
lvm2: 2.03.16-2
lxc-pve: 6.0.0-1
lxcfs: 6.0.0-pve2
novnc-pve: 1.4.0-4
proxmox-backup-client: 3.2.7-1
proxmox-backup-file-restore: 3.2.7-1
proxmox-firewall: 0.5.0
proxmox-kernel-helper: 8.1.0
proxmox-mail-forward: 0.2.3
proxmox-mini-journalreader: 1.4.0
proxmox-offline-mirror-helper: 0.6.7
proxmox-widget-toolkit: 4.2.4
pve-cluster: 8.0.8
pve-container: 5.2.0
pve-docs: 8.2.3
pve-edk2-firmware: 4.2023.08-4
pve-esxi-import-tools: 0.7.2
pve-firewall: 5.0.7
pve-firmware: 3.14-1
pve-ha-manager: 4.0.5
pve-i18n: 3.2.4
pve-qemu-kvm: 9.0.2-3
pve-xtermjs: 5.3.0-3
qemu-server: 8.2.4
smartmontools: 7.3-pve1
spiceterm: 3.3.0
swtpm: 0.8.0+pve1
vncterm: 1.8.0
zfsutils-linux: 2.2.6-pve1
Code:
root@S-1121:~# pveversion -v
proxmox-ve: 8.2.0 (running kernel: 6.8.12-3-pve)
pve-manager: 8.2.7 (running version: 8.2.7/3e0176e6bb2ade3b)
proxmox-kernel-helper: 8.1.0
proxmox-kernel-6.8: 6.8.12-3
proxmox-kernel-6.8.12-3-pve-signed: 6.8.12-3
proxmox-kernel-6.8.4-2-pve-signed: 6.8.4-2
ceph: 18.2.4-pve3
ceph-fuse: 18.2.4-pve3
corosync: 3.1.7-pve3
criu: 3.17.1-2
glusterfs-client: 10.3-5
ifupdown2: 3.2.0-1+pmx9
ksm-control-daemon: 1.5-1
libjs-extjs: 7.0.0-4
libknet1: 1.28-pve1
libproxmox-acme-perl: 1.5.1
libproxmox-backup-qemu0: 1.4.1
libproxmox-rs-perl: 0.3.4
libpve-access-control: 8.1.4
libpve-apiclient-perl: 3.3.2
libpve-cluster-api-perl: 8.0.8
libpve-cluster-perl: 8.0.8
libpve-common-perl: 8.2.5
libpve-guest-common-perl: 5.1.4
libpve-http-server-perl: 5.1.2
libpve-network-perl: 0.9.8
libpve-rs-perl: 0.8.10
libpve-storage-perl: 8.2.5
libspice-server1: 0.15.1-1
lvm2: 2.03.16-2
lxc-pve: 6.0.0-1
lxcfs: 6.0.0-pve2
novnc-pve: 1.4.0-4
proxmox-backup-client: 3.2.7-1
proxmox-backup-file-restore: 3.2.7-1
proxmox-firewall: 0.5.0
proxmox-kernel-helper: 8.1.0
proxmox-mail-forward: 0.2.3
proxmox-mini-journalreader: 1.4.0
proxmox-offline-mirror-helper: 0.6.7
proxmox-widget-toolkit: 4.2.4
pve-cluster: 8.0.8
pve-container: 5.2.0
pve-docs: 8.2.3
pve-edk2-firmware: 4.2023.08-4
pve-esxi-import-tools: 0.7.2
pve-firewall: 5.0.7
pve-firmware: 3.14-1
pve-ha-manager: 4.0.5
pve-i18n: 3.2.4
pve-qemu-kvm: 9.0.2-3
pve-xtermjs: 5.3.0-3
qemu-server: 8.2.4
smartmontools: 7.3-pve1
spiceterm: 3.3.0
swtpm: 0.8.0+pve1
vncterm: 1.8.0
zfsutils-linux: 2.2.6-pve1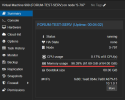
")