SMART error (Health) detected on host

NOIDSR

Member
Mar 1, 2021
53
2
8
31
Hello,

I started getting error messages every 24 hours for one one of my nvme drives attached to one of my MAC OS VMs giving temperature warnings. Although I don't see any particular temperature shown in the message.

"
The following warning/error was logged by the smartd daemon:
Device: /dev/nvme0, Critical Warning (0x02): Temperature
Device info:
Samsung SSD 980 1TB, S/N:S649NJ0R227848W, FW:1B4QFXO7, 1.00 TB
"
Can anyone help on finding more info and how to fix it? Thank you
 
Maybe you should check first how hot that SSD actually gets when it is under high load. If it really gets hot (you could check the smart attributes with smartctl -a /dev/nvme0, maybe its also logging min and max temperatures) you should add a better heatsink to that SSD instead of just disabling the log messages. High temperatures are neigher good for the helth nor for the performance, as the SSD will need to throttle down.
 
Maybe you should check first how hot that SSD actually gets when it is under high load. If it really gets hot (you could check the smart attributes with smartctl -a /dev/nvme0, maybe its also logging min and max temperatures) you should add a better heatsink to that SSD instead of just disabling the log messages. High temperatures are neigher good for the helth nor for the performance, as the SSD will need to throttle down.
Thanks, Dunuin. I ran this command while busy on this VM but it seems everything is OK so I could not replicate. Maybe it is a false alarm generated by proxmox? If there were errors can I access it with the command to see the time when it happened? NVME is sitting already on a small heat sink on the motherboard. Here is what I get with smartctl -a /dev/nvme0:


=== START OF SMART DATA SECTION ===
SMART overall-health self-assessment test result: PASSED

SMART/Health Information (NVMe Log 0x02)
Critical Warning: 0x00
Temperature: 39 Celsius
Available Spare: 100%
Available Spare Threshold: 10%
Percentage Used: 0%
Data Units Read: 3,941,700 [2.01 TB]
Data Units Written: 3,096,712 [1.58 TB]
Host Read Commands: 8,893,402
Host Write Commands: 3,041,285
Controller Busy Time: 34
Power Cycles: 309
Power On Hours: 39
Unsafe Shutdowns: 138
Media and Data Integrity Errors: 0
Error Information Log Entries: 0
Warning Comp. Temperature Time: 0
Critical Comp. Temperature Time: 0
Temperature Sensor 1: 39 Celsius
Temperature Sensor 2: 40 Celsius
Thermal Temp. 2 Transition Count: 17
Thermal Temp. 2 Total Time: 12

Error Information (NVMe Log 0x01, 16 of 64 entries)
No Errors Logged

Thanks!
 
I think if your SSD reached a very high temperature (like 80 deg C) before your "Warning Comp. Temperature Time" shouldn't be 0.
 
I think if your SSD reached a very high temperature (like 80 deg C) before your "Warning Comp. Temperature Time" shouldn't be 0.
OK you right. Maybe messages I am getting is because the warning temp is set to 0...But before I upgraded proxmox I have not received anything similar. How would I change Critical and Warning temp threshold?
 
I have the same SSD, and the same issue. The smartctl errors are driving me crazy, I receive them several times a day and each time I test with smartctl, I can't seem to find an actual issue.

If it means anything, I have two Proxmox nodes, both built the same way and in the same rack. The only difference between them is that one of them has a Samsung SSD, the other does not. And it's the server with the Samsung SSD that's complaining. Since they're both in the same rack and have the same hardware, there's not much of a temperature variance between them most of the time. Also, they perform a low amount of load and rarely ever reach 50% busy.
 
I am getting these errors on both of my nvme drives now as well. Just a few moments ago it got the following:

Code:
This message was generated by the smartd daemon running on:

   host name:  pm
   DNS domain: xx

The following warning/error was logged by the smartd daemon:

Device: /dev/nvme0, Critical Warning (0x02): Temperature

Device info:
Samsung SSD 980 500GB, S/N:xx, FW:1B4QFXO7, 500 GB

For details see host's SYSLOG.

You can also use the smartctl utility for further investigation.
The original message about this issue was sent at Sat May 21 13:32:30 2022 EDT
Another message will be sent in 24 hours if the problem persists.

I have been running watch nvme smart-log /dev/nvme0 to monitor the temp. It looks to be in normal range:

Code:
Every 2.0s: nvme smart-log /dev/nvme0                                                                   pm: Tue May 31 19:52:41 2022

Smart Log for NVME device:nvme0 namespace-id:ffffffff
critical_warning                        : 0
temperature                             : 36 C
available_spare                         : 100%
available_spare_threshold               : 10%
percentage_used                         : 10%
endurance group critical warning summary: 0
data_units_read                         : 151,733,826
data_units_written                      : 84,241,083
host_read_commands                      : 1,938,796,004
host_write_commands                     : 3,652,860,626
controller_busy_time                    : 2,415
power_cycles                            : 140
power_on_hours                          : 5,104
unsafe_shutdowns                        : 61
media_errors                            : 0
num_err_log_entries                     : 0
Warning Temperature Time                : 209
Critical Composite Temperature Time     : 0
Temperature Sensor 1           : 36 C
Temperature Sensor 2           : 39 C
Thermal Management T1 Trans Count       : 0
Thermal Management T2 Trans Count       : 15819
Thermal Management T1 Total Time        : 0
Thermal Management T2 Total Time        : 11737

Syslog around that time:

Code:
May 31 19:42:57 pm smartd[6744]: Device: /dev/sdv [SAT], SMART Usage Attribute: 194 Temperature_Celsius changed from 58 to 56
May 31 19:42:58 pm smartd[6744]: Device: /dev/nvme0, Critical Warning (0x02): Temperature
May 31 19:42:58 pm smartd[6744]: Sending warning via /usr/share/smartmontools/smartd-runner to root ...
May 31 19:42:58 pm smartd[6744]: Warning via /usr/share/smartmontools/smartd-runner to root: successful

Doesnt seem to even log the actual temp recorded?

Feel like I am missing something here?


Edit: Adding more details:

Code:
Kernel Version Linux 5.15.35-1-pve #1 SMP PVE 5.15.35-3 (Wed, 11 May 2022 07:57:51 +0200)
PVE Manager Version pve-manager/7.2-4/ca9d43cc
 
Last edited:
Hi, I was worried about the same thing, but I left it because it was effective when I looked at the ArchLinux wiki and took measures.

https://wiki.archlinux.org/title/Solid_state_drive/NVMe

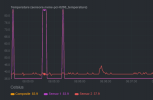
Setting the following to gurb eliminated the temperature spikes in all three clusters.
Code:
nvme_core.default_ps_max_latency_us=0

You can see that there are no temperature spikes after applying the settings to the entire cluster around 9:31 in the attached image.
D7094C89-80E7-40B8-8510-E1865ACEB098.jpeg

versions
Code:
> pveversion
pve-manager/7.2-4/ca9d43cc (running kernel: 5.15.35-1-pve)
 
What are you using to generate this graph?
Yes, I use Zabbix.
I guessed it was a software bug like the people in this thread, so I started by measuring it.
Information was easily obtained by using Zabbix and zabbix-agent2 in combination. It is the attached graph.
If you want to do the same, you'll need to add some settings to sudoers, so the thread below will help.
https://www.zabbix.com/forum/zabbix...r-official-zabbix-smart-disk-monitoring/page3

The template is below.
https://www.zabbix.com/integrations/smart
 
Last edited:
I have the Samsung 980 NVMe (MZ-V8V500B/AM specifically)

And my issue is showing up almost the same: By default, the NVMe SMART sensors are showing either something reasonable (29.85-32.85C (Though always .85)), or a warning temp of 83.85C.

There's nothing in between. If I had graphs they would probably look exactly like naa0yama or godsavethequ33n's.
Also: Adding an NVMe heatsink with fan did not affect it.

I've just modified grub as stated above and will continue testing, but I'm curious about two things:

1. How do we set nvme_core.default_ps_max_latency_us=0 via modprobe.d?
2. How do we verify what the current default_ps_max_latency_us is once booted in to Proxmox?
 
Last edited:
Last edited:

About

The Proxmox community has been around for many years and offers help and support for Proxmox VE, Proxmox Backup Server, and Proxmox Mail Gateway.
We think our community is one of the best thanks to people like you!

Get your subscription!

The Proxmox team works very hard to make sure you are running the best software and getting stable updates and security enhancements, as well as quick enterprise support. Tens of thousands of happy customers have a Proxmox subscription. Get yours easily in our online shop.

Buy now!