Hi!
I can not establish the cause of unexpected reboots 2 (from 3) nodes in my cluster.
Over the past 48 hours, few unexpected reboots. It reboots one node several times, then another node also.
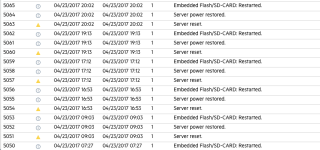
iLO events log:

This happened after the last update (from pve-no-subscription). But on this cluster only.
On the other cluster with same updates it does not observe...
What could be the reason?
Best regards,
Gosha
I can not establish the cause of unexpected reboots 2 (from 3) nodes in my cluster.
Over the past 48 hours, few unexpected reboots. It reboots one node several times, then another node also.
Apr 23 23:39:46 acn2 corosync[1776]: [TOTEM ] A processor failed, forming new configuration.
Apr 23 23:39:46 acn2 corosync[1776]: [TOTEM ] A new membership (192.168.0.220:3152) was formed. Members
Apr 23 23:39:46 acn2 corosync[1776]: [QUORUM] Members[3]: 2 3 1
Apr 23 23:39:46 acn2 corosync[1776]: [MAIN ] Completed service synchronization, ready to provide service.
Apr 23 23:40:43 acn2 pvestatd[1815]: status update time (6.576 seconds)
Apr 23 23:41:01 acn2 corosync[1776]: [TOTEM ] A processor failed, forming new configuration.
Apr 23 23:41:02 acn2 corosync[1776]: [TOTEM ] A new membership (192.168.0.220:3156) was formed. Members
Apr 23 23:41:02 acn2 corosync[1776]: [QUORUM] Members[3]: 2 3 1
Apr 23 23:41:02 acn2 corosync[1776]: [MAIN ] Completed service synchronization, ready to provide service.
Apr 23 23:41:14 acn2 pvestatd[1815]: status update time (7.265 seconds)
Apr 23 23:41:45 acn2 pvestatd[1815]: status update time (7.644 seconds)
Apr 23 23:43:12 acn2 pvestatd[1815]: status update time (5.441 seconds)
Apr 23 23:47:43 acn2 pvestatd[1815]: status update time (6.119 seconds)
Apr 23 23:48:13 acn2 pvestatd[1815]: status update time (5.876 seconds)
Apr 23 23:50:12 acn2 pvestatd[1815]: status update time (5.221 seconds)
Apr 23 23:52:44 acn2 pvestatd[1815]: status update time (6.771 seconds)
Apr 23 23:53:02 acn2 pvestatd[1815]: status update time (5.192 seconds)
Apr 23 23:54:14 acn2 pvestatd[1815]: status update time (6.540 seconds)
Apr 23 23:54:44 acn2 pvestatd[1815]: status update time (6.928 seconds)
Apr 23 23:54:53 acn2 smartd[1573]: Device: /dev/sdc [SAT], SMART Prefailure Attribute: 1 Raw_Read_Error_Rate changed from 65 to 69
Apr 23 23:54:53 acn2 smartd[1573]: Device: /dev/sdc [SAT], SMART Usage Attribute: 194 Temperature_Celsius changed from 30 to 31
Apr 23 23:54:53 acn2 smartd[1573]: Device: /dev/sdd [SAT], SMART Usage Attribute: 194 Temperature_Celsius changed from 28 to 29
Apr 23 23:55:14 acn2 pvestatd[1815]: status update time (6.147 seconds)
Apr 23 23:55:46 acn2 corosync[1776]: [TOTEM ] A processor failed, forming new configuration.
Apr 23 23:55:49 acn2 corosync[1776]: [TOTEM ] A new membership (192.168.0.220:3160) was formed. Members left: 3
Apr 23 23:55:49 acn2 corosync[1776]: [TOTEM ] Failed to receive the leave message. failed: 3
Apr 23 23:55:49 acn2 pmxcfs[1708]: [dcdb] notice: members: 1/1855, 2/1708
Apr 23 23:55:49 acn2 pmxcfs[1708]: [dcdb] notice: starting data syncronisation
Apr 23 23:55:49 acn2 pmxcfs[1708]: [status] notice: members: 1/1855, 2/1708
Apr 23 23:55:49 acn2 pmxcfs[1708]: [status] notice: starting data syncronisation
Apr 23 23:55:49 acn2 corosync[1776]: [QUORUM] Members[2]: 2 1
Apr 23 23:55:49 acn2 corosync[1776]: [MAIN ] Completed service synchronization, ready to provide service.
Apr 23 23:55:49 acn2 pmxcfs[1708]: [dcdb] notice: received sync request (epoch 1/1855/00000006)
Apr 23 23:55:49 acn2 pmxcfs[1708]: [status] notice: received sync request (epoch 1/1855/00000006)
Apr 23 23:55:49 acn2 pmxcfs[1708]: [dcdb] notice: received all states
Apr 23 23:55:49 acn2 pmxcfs[1708]: [dcdb] notice: leader is 1/1855
Apr 23 23:55:49 acn2 pmxcfs[1708]: [dcdb] notice: synced members: 1/1855, 2/1708
Apr 23 23:55:49 acn2 pmxcfs[1708]: [dcdb] notice: all data is up to date
Apr 23 23:55:49 acn2 pmxcfs[1708]: [dcdb] notice: dfsm_deliver_queue: queue length 4
Apr 23 23:55:49 acn2 pmxcfs[1708]: [status] notice: received all states
Apr 23 23:55:49 acn2 pmxcfs[1708]: [status] notice: all data is up to date
Apr 23 23:55:49 acn2 pmxcfs[1708]: [status] notice: dfsm_deliver_queue: queue length 7
Apr 23 23:55:51 acn2 corosync[1776]: [TOTEM ] A new membership (192.168.0.220:3164) was formed. Members joined: 3
Apr 23 23:55:51 acn2 pmxcfs[1708]: [dcdb] notice: members: 1/1855, 2/1708, 3/938
Apr 23 23:55:51 acn2 pmxcfs[1708]: [dcdb] notice: starting data syncronisation
Apr 23 23:55:51 acn2 pmxcfs[1708]: [status] notice: members: 1/1855, 2/1708, 3/938
Apr 23 23:55:51 acn2 pmxcfs[1708]: [status] notice: starting data syncronisation
Apr 23 23:55:51 acn2 corosync[1776]: [QUORUM] Members[3]: 2 3 1
Apr 23 23:55:51 acn2 corosync[1776]: [MAIN ] Completed service synchronization, ready to provide service.
Apr 23 23:55:51 acn2 pmxcfs[1708]: [dcdb] notice: received sync request (epoch 1/1855/00000007)
Apr 23 23:55:51 acn2 pmxcfs[1708]: [status] notice: received sync request (epoch 1/1855/00000007)
Apr 23 23:56:13 acn2 pvestatd[1815]: status update time (6.012 seconds)
****************************
Unexpected reboot point here
****************************
Apr 23 23:58:31 acn2 systemd-modules-load[265]: Module 'fuse' is builtin
Apr 23 23:58:31 acn2 systemd-modules-load[265]: Inserted module 'vhost_net'
Apr 23 23:58:31 acn2 kernel: [ 0.000000] Initializing cgroup subsys cpuset
Apr 23 23:58:31 acn2 systemd[1]: Started Load Kernel Modules.
Apr 23 23:58:31 acn2 kernel: [ 0.000000] Initializing cgroup subsys cpu
Apr 23 23:58:31 acn2 kernel: [ 0.000000] Initializing cgroup subsys cpuacct
Apr 23 23:58:31 acn2 systemd[1]: Mounted Configuration File System.
Apr 23 23:58:31 acn2 kernel: [ 0.000000] Linux version 4.4.49-1-pve (root@nora) (gcc version 4.9.2 (Debian 4.9.2-10) ) #1 SMP PVE 4.4.49-86 (Thu, 30 Mar 2017 08:39:20 +0200) ()
........
iLO events log:

This happened after the last update (from pve-no-subscription). But on this cluster only.
On the other cluster with same updates it does not observe...
What could be the reason?
proxmox-ve: 4.4-86 (running kernel: 4.4.49-1-pve)
pve-manager: 4.4-13 (running version: 4.4-13/7ea56165)
pve-kernel-4.4.49-1-pve: 4.4.49-86 lvm2: 2.02.116-pve3 corosync-pve: 2.4.2-2~pve4+1 libqb0: 1.0.1-1 pve-cluster: 4.0-49 qemu-server: 4.0-110 pve-firmware: 1.1-11 libpve-common-perl: 4.0-94 libpve-access-control: 4.0-23 libpve-storage-perl: 4.0-76 pve-libspice-server1: 0.12.8-2 vncterm: 1.3-2 pve-docs: 4.4-4 pve-qemu-kvm: 2.7.1-4 pve-container: 1.0-97 pve-firewall: 2.0-33 pve-ha-manager: 1.0-40 ksm-control-daemon: 1.2-1 glusterfs-client: 3.5.2-2+deb8u3 lxc-pve: 2.0.7-4 lxcfs: 2.0.6-pve1 criu: 1.6.0-1 novnc-pve: 0.5-9 smartmontools: 6.5+svn4324-1~pve80
Best regards,
Gosha
Last edited:


