ZFS over iSCSI slowness

jslanier

Well-Known Member
Jan 19, 2019
45
0
46
41
I have a 1 node Proxmox setup that I primarily use for 1 Plex Linux VM. I have 2 OmniOS storage boxes with large striped RaidZ2 arrays for all the media storage. I am using 10Gb networking to access both storage boxes via ZFS over iSCSI. The drives in both of the storage machines are very similar. I have the 8TB WD Easystore Drives in one and the 10TB WD Easystore drives in the other.

The Linux VM uses local SSD storage for / partition and then I have 2 large disks from the ZFS over iSCSI connections that are mounted at /r510 and /supermicro respectfully.

The storage mounted at /r510 is significantly slower than the storage mounted at /supermicro and I am having trouble figuring out why.

The R510 zfs pool info from its storage box:
root@kylefiber:/ringo# zfs get all ringo NAME PROPERTY VALUE SOURCE ringo type filesystem - ringo creation Sat Feb 5 22:06 2022 - ringo used 1.83T - ringo available 54.5T - ringo referenced 192K - ringo compressratio 1.00x - ringo mounted yes - ringo quota none default ringo reservation none default ringo recordsize 128K default ringo mountpoint /ringo default ringo sharenfs off default ringo checksum on default ringo compression lz4 local ringo atime on default ringo devices on default ringo exec on default ringo setuid on default ringo readonly off default ringo zoned off default ringo snapdir hidden default ringo aclmode discard default ringo aclinherit restricted default ringo createtxg 1 - ringo canmount on default ringo xattr on default ringo copies 1 default ringo version 5 - ringo utf8only off - ringo normalization none - ringo casesensitivity sensitive - ringo vscan off default ringo nbmand off default ringo sharesmb off default ringo refquota none default ringo refreservation none default ringo guid 5882232683570146752 - ringo primarycache all default ringo secondarycache all default ringo usedbysnapshots 0 - ringo usedbydataset 192K - ringo usedbychildren 1.83T - ringo usedbyrefreservation 0 - ringo logbias latency default ringo dedup off default ringo mlslabel none default ringo sync standard default ringo dnodesize legacy default ringo refcompressratio 1.00x - ringo written 192K - ringo logicalused 1.84T - ringo logicalreferenced 42.5K - ringo filesystem_limit none default ringo snapshot_limit none default ringo filesystem_count none default ringo snapshot_count none default ringo redundant_metadata all default ringo special_small_blocks 0 default ringo encryption off default ringo keylocation none default ringo keyformat none default ringo pbkdf2iters 0 default

The supermicro ZFS pool info:
root@datastor1:/goliath# zfs get all goliath NAME PROPERTY VALUE SOURCE goliath type filesystem - goliath creation Sun Mar 17 12:51 2019 - goliath used 68.4T - goliath available 31.8T - goliath referenced 188K - goliath compressratio 1.00x - goliath mounted yes - goliath quota none default goliath reservation none default goliath recordsize 128K default goliath mountpoint /goliath default goliath sharenfs off default goliath checksum on default goliath compression lz4 local goliath atime on default goliath devices on default goliath exec on default goliath setuid on default goliath readonly off default goliath zoned off default goliath snapdir hidden default goliath aclmode discard default goliath aclinherit restricted default goliath createtxg 1 - goliath canmount on default goliath xattr on default goliath copies 1 default goliath version 5 - goliath utf8only off - goliath normalization none - goliath casesensitivity sensitive - goliath vscan off default goliath nbmand off default goliath sharesmb off default goliath refquota none default goliath refreservation none default goliath guid 43795343080512498 - goliath primarycache all default goliath secondarycache all default goliath usedbysnapshots 0 - goliath usedbydataset 188K - goliath usedbychildren 68.4T - goliath usedbyrefreservation 0 - goliath logbias latency default goliath dedup off default goliath mlslabel none default goliath sync standard default goliath dnodesize legacy default goliath refcompressratio 1.00x - goliath written 188K - goliath logicalused 68.7T - goliath logicalreferenced 36.5K - goliath filesystem_limit none default goliath snapshot_limit none default goliath filesystem_count none default goliath snapshot_count none default goliath redundant_metadata all default

Pool info for supermicro (goliath):
root@datastor1:/goliath# zpool status pool: goliath state: ONLINE scan: resilvered 5.77T in 62h57m with 0 errors on Wed Feb 2 10:49:55 2022 config: NAME STATE READ WRITE CKSUM goliath ONLINE 0 0 0 raidz2-0 ONLINE 0 0 0 c0t5000CCA26DC076F6d0 ONLINE 0 0 0 c0t5000CCA26DC06983d0 ONLINE 0 0 0 c0t5000CCA267C2B59Fd0 ONLINE 0 0 0 c0t5000CCA267C34DD8d0 ONLINE 0 0 0 c0t5000CCA267C38EA5d0 ONLINE 0 0 0 c0t5000CCA273DA0C9Fd0 ONLINE 0 0 0 c0t5000CCA27EC23929d0 ONLINE 0 0 0 c0t5000CCA273DBAFCEd0 ONLINE 0 0 0 raidz2-1 ONLINE 0 0 0 c0t5000CCA273DC9BA5d0 ONLINE 0 0 0 c0t5000CCA273DCF74Ed0 ONLINE 0 0 0 c0t5000CCA273DD5EE8d0 ONLINE 0 0 0 c0t5000CCA273DD8A5Dd0 ONLINE 0 0 0 c0t5000CCA273DD9AE6d0 ONLINE 0 0 0 c0t5000CCA273DD885Ad0 ONLINE 0 0 0 c0t5000CCA273DDD913d0 ONLINE 0 0 0 c0t5000CCA273DFD987d0 ONLINE 0 0 0

Pool info for r510 (ringo):
root@kylefiber:/ringo# zpool status pool: ringo state: ONLINE scan: none requested config: NAME STATE READ WRITE CKSUM ringo ONLINE 0 0 0 raidz2-0 ONLINE 0 0 0 c0t5000CCA252C85F49d0 ONLINE 0 0 0 c0t5000CCA252C93E77d0 ONLINE 0 0 0 c0t5000CCA252C93E83d0 ONLINE 0 0 0 c0t5000CCA252C861ADd0 ONLINE 0 0 0 c0t5000CCA252C920E0d0 ONLINE 0 0 0 c0t5000CCA252C960E3d0 ONLINE 0 0 0 raidz2-1 ONLINE 0 0 0 c0t5000CCA252C8564Ed0 ONLINE 0 0 0 c0t5000CCA252C93595d0 ONLINE 0 0 0 c0t5000CCA252CB0D97d0 ONLINE 0 0 0 c0t5000CCA252CB51FAd0 ONLINE 0 0 0 c0t5000CCA252CBA6ABd0 ONLINE 0 0 0 c0t5000CCA252CC4F15d0 ONLINE 0 0 0

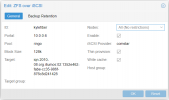
Connection settings in Proxmox are identical. Disk settings are identical (discard on and cache is default-none).

Speed test directly on r510 (slower one):
root@kylefiber:/ringo# dd if=/dev/zero of=/ringo/dd.tst bs=32768000 count=3125 3125+0 records in 3125+0 records out 102400000000 bytes transferred in 67.263680 secs (1.42GB/sec) root@kylefiber:/ringo# dd if=/ringo/dd.tst of=/dev/null bs=32768000 count=3125 3125+0 records in 3125+0 records out 102400000000 bytes transferred in 42.449120 secs (2.25GB/sec)

Speed test directly on Supermicro (faster one):
root@datastor1:~# dd if=/dev/zero of=/goliath/test.file bs=32768000 count=3125 3125+0 records in 3125+0 records out 102400000000 bytes transferred in 36.609472 secs (2.60GB/sec) root@datastor1:~# dd if=/goliath/test.file of=/dev/null bs=32768000 count=3125 3125+0 records in 3125+0 records out 102400000000 bytes transferred in 13.164774 secs (7.24GB/sec)

I can get the results of the dd tests from the VM for each disk, but when I ran them earlier, the write speed for the r510 was like 72MB/sec in the VM and the write speed for the supermicro disk was around 400 MB/sec.

What could be contributing to the large difference in speed?

Additional note: the faster pool only has 8GB RAM. Slower pool has 24GB RAM.

Pics of connection info:
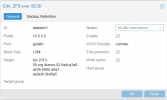
datastor1.PNG
ringo.PNG

Thanks for any help.
 
Did you verify that the 8TB WD Easystore Drives are all CMR (if the 8TB WDs support TRIM/discard they should be SMR)? Newer shucked 8TB WD drives can be SMR and SMR disks got a very bad write performance, especially with ZFS where they shouldn't be used with.
 
Last edited:
How does the rest of the systems look like?
Especially CPU and network wise?
Iscsi is heavily depending on the cpu speed and clockcount
 
Did you verify that the 8TB WD Easystore Drives are all CMR (if the 8TB WDs support TRIM/discard they should be SMR)? Newer shucked 8TB WD drives can be SMR and SMR disks got a very bad write performance, especially with ZFS where they shouldn't be used with.
WD80EFAX are CMR.
 
They clock at 2.8 GHz - that's not too bad.
Anything particular in the logs?
 
Well, they differ a lot too.
Hence I was asking.
Iscsi can be a beast. Especially when troubleshooting.

I'd go and first test the line-speed from your host to each zfs server via iperf.
Depending on the result next actions can be taken.

Maybe we are working towards the wrong direction ATM.
 
Well, they differ a lot too.
Hence I was asking.
Iscsi can be a beast. Especially when troubleshooting.

I'd go and first test the line-speed from your host to each zfs server via iperf.
Depending on the result next actions can be taken.

Maybe we are working towards the wrong direction ATM.
I think I expected the supermicro to be a touch faster because the raidz2 vdevs are a bit larger (8 disks instead of 6). iperf results from Proxmox host to both ZFS omnios boxes are similar:
root@pve-otclan:~# iperf3 -c 10.0.0.6 Connecting to host 10.0.0.6, port 5201 [ 5] local 10.0.0.3 port 39984 connected to 10.0.0.6 port 5201 [ ID] Interval Transfer Bitrate Retr Cwnd [ 5] 0.00-1.00 sec 852 MBytes 7.15 Gbits/sec 0 257 KBytes [ 5] 1.00-2.00 sec 855 MBytes 7.17 Gbits/sec 0 257 KBytes [ 5] 2.00-3.00 sec 841 MBytes 7.05 Gbits/sec 0 257 KBytes [ 5] 3.00-4.00 sec 810 MBytes 6.80 Gbits/sec 0 257 KBytes [ 5] 4.00-5.00 sec 813 MBytes 6.82 Gbits/sec 0 257 KBytes [ 5] 5.00-6.00 sec 800 MBytes 6.71 Gbits/sec 0 257 KBytes [ 5] 6.00-7.00 sec 803 MBytes 6.73 Gbits/sec 0 257 KBytes [ 5] 7.00-8.00 sec 797 MBytes 6.69 Gbits/sec 0 257 KBytes [ 5] 8.00-9.00 sec 805 MBytes 6.74 Gbits/sec 0 257 KBytes [ 5] 9.00-10.00 sec 964 MBytes 8.10 Gbits/sec 0 257 KBytes - - - - - - - - - - - - - - - - - - - - - - - - - [ ID] Interval Transfer Bitrate Retr [ 5] 0.00-10.00 sec 8.14 GBytes 7.00 Gbits/sec 0 sender [ 5] 0.00-10.00 sec 8.14 GBytes 7.00 Gbits/sec receiver iperf Done. root@pve-otclan:~# iperf3 -c 10.0.0.5 Connecting to host 10.0.0.5, port 5201 [ 5] local 10.0.0.3 port 49462 connected to 10.0.0.5 port 5201 [ ID] Interval Transfer Bitrate Retr Cwnd [ 5] 0.00-1.00 sec 854 MBytes 7.16 Gbits/sec 0 271 KBytes [ 5] 1.00-2.00 sec 850 MBytes 7.13 Gbits/sec 0 271 KBytes [ 5] 2.00-3.00 sec 888 MBytes 7.45 Gbits/sec 0 271 KBytes [ 5] 3.00-4.00 sec 899 MBytes 7.54 Gbits/sec 0 271 KBytes [ 5] 4.00-5.00 sec 881 MBytes 7.39 Gbits/sec 0 271 KBytes [ 5] 5.00-6.00 sec 980 MBytes 8.22 Gbits/sec 0 271 KBytes [ 5] 6.00-7.00 sec 913 MBytes 7.66 Gbits/sec 0 271 KBytes [ 5] 7.00-8.00 sec 877 MBytes 7.36 Gbits/sec 0 271 KBytes [ 5] 8.00-9.00 sec 892 MBytes 7.48 Gbits/sec 0 271 KBytes [ 5] 9.00-10.00 sec 994 MBytes 8.34 Gbits/sec 0 271 KBytes - - - - - - - - - - - - - - - - - - - - - - - - - [ ID] Interval Transfer Bitrate Retr [ 5] 0.00-10.00 sec 8.82 GBytes 7.57 Gbits/sec 0 sender [ 5] 0.00-10.00 sec 8.82 GBytes 7.57 Gbits/sec receiver iperf Done.

10.0.0.6 is the r510
 
That does not look too Bad. So the wire seems to be "OK".

Next step I would create a ramdisk on both servers and try to export those through iscsi. Read/write to them also should create similar results.
If that's the case we are back at square 1 but at least we have ruled some stuff out.

The larger vdevs should not matter too much in my opinion.
Do you experience the difference in results both reads and writes?
Good questions about the read speeds. I had actually assumed read speeds were equally as bad, but they are not. Here is the result of both read tests from inside the VM:
jslanier@plex-new:/r510$ sudo dd if=/r510/testfile of=/dev/null bs=32768000 count=3125 [sudo] password for jslanier: 1638+1 records in 1638+1 records out 53687091200 bytes (54 GB, 50 GiB) copied, 96.7541 s, 555 MB/s jslanier@plex-new:/r510$ sudo dd if=/supermicro/testfile of=/dev/null bs=32768000 count=3125 1638+1 records in 1638+1 records out 53687091200 bytes (54 GB, 50 GiB) copied, 78.8598 s, 681 MB/s
So what about the writeback option on the disk in Proxmox? Do we think that changes anything? I am not sure exactly what that option does.
 
Reads differ but not as bad. That brings us back to your zfs pool write speeds when using iscsi. Interesting I have to admit that.

Can you see any difference in the zfs itself that you have created on top of the zpools?
When having raid-z then there might.be some overhead through padding. From my understanding that only should affect your writes.
 
They look the same other than a few added newer features on the r510 pool:
root@kylefiber:/ringo# zfs get all ringo/vm-102-disk-0 NAME PROPERTY VALUE SOURCE ringo/vm-102-disk-0 type volume - ringo/vm-102-disk-0 creation Sat Feb 5 22:38 2022 - ringo/vm-102-disk-0 used 1.83T - ringo/vm-102-disk-0 available 54.5T - ringo/vm-102-disk-0 referenced 1.83T - ringo/vm-102-disk-0 compressratio 1.00x - ringo/vm-102-disk-0 reservation none default ringo/vm-102-disk-0 volsize 55T local ringo/vm-102-disk-0 volblocksize 128K - ringo/vm-102-disk-0 checksum on default ringo/vm-102-disk-0 compression lz4 inherited from ringo ringo/vm-102-disk-0 readonly off default ringo/vm-102-disk-0 createtxg 391 - ringo/vm-102-disk-0 copies 1 default ringo/vm-102-disk-0 refreservation none default ringo/vm-102-disk-0 guid 14133302591104161534 - ringo/vm-102-disk-0 primarycache all default ringo/vm-102-disk-0 secondarycache all default ringo/vm-102-disk-0 usedbysnapshots 0 - ringo/vm-102-disk-0 usedbydataset 1.83T - ringo/vm-102-disk-0 usedbychildren 0 - ringo/vm-102-disk-0 usedbyrefreservation 0 - ringo/vm-102-disk-0 logbias latency default ringo/vm-102-disk-0 dedup off default ringo/vm-102-disk-0 mlslabel none default ringo/vm-102-disk-0 sync standard default ringo/vm-102-disk-0 refcompressratio 1.00x - ringo/vm-102-disk-0 written 1.83T - ringo/vm-102-disk-0 logicalused 1.84T - ringo/vm-102-disk-0 logicalreferenced 1.84T - ringo/vm-102-disk-0 snapshot_limit none default ringo/vm-102-disk-0 snapshot_count none default ringo/vm-102-disk-0 redundant_metadata all default ringo/vm-102-disk-0 encryption off default ringo/vm-102-disk-0 keylocation none default ringo/vm-102-disk-0 keyformat none default ringo/vm-102-disk-0 pbkdf2iters 0 default

Here is the pool that writes faster:
root@datastor1:/goliath# zfs get all goliath/vm-102-disk-0 NAME PROPERTY VALUE SOURCE goliath/vm-102-disk-0 type volume - goliath/vm-102-disk-0 creation Wed Jan 1 11:01 2020 - goliath/vm-102-disk-0 used 68.4T - goliath/vm-102-disk-0 available 31.8T - goliath/vm-102-disk-0 referenced 68.4T - goliath/vm-102-disk-0 compressratio 1.00x - goliath/vm-102-disk-0 reservation none default goliath/vm-102-disk-0 volsize 80T local goliath/vm-102-disk-0 volblocksize 128K - goliath/vm-102-disk-0 checksum on default goliath/vm-102-disk-0 compression lz4 inherited from goliath goliath/vm-102-disk-0 readonly off default goliath/vm-102-disk-0 createtxg 3568272 - goliath/vm-102-disk-0 copies 1 default goliath/vm-102-disk-0 refreservation none default goliath/vm-102-disk-0 guid 7565805405154770870 - goliath/vm-102-disk-0 primarycache all default goliath/vm-102-disk-0 secondarycache all default goliath/vm-102-disk-0 usedbysnapshots 0 - goliath/vm-102-disk-0 usedbydataset 68.4T - goliath/vm-102-disk-0 usedbychildren 0 - goliath/vm-102-disk-0 usedbyrefreservation 0 - goliath/vm-102-disk-0 logbias latency default goliath/vm-102-disk-0 dedup off default goliath/vm-102-disk-0 mlslabel none default goliath/vm-102-disk-0 sync standard default goliath/vm-102-disk-0 refcompressratio 1.00x - goliath/vm-102-disk-0 written 68.4T - goliath/vm-102-disk-0 logicalused 68.7T - goliath/vm-102-disk-0 logicalreferenced 68.7T - goliath/vm-102-disk-0 snapshot_limit none default goliath/vm-102-disk-0 snapshot_count none default goliath/vm-102-disk-0 redundant_metadata all default
 
Volblocksize is both 128K. That should result in 33% padding+parity overhead for both pools. So your 16 disk pool is actually wasting a little bit more capacity. With a volblocksize of 256K the padding+parity overhead should go down to 29%. An with 1M volblocksize even down to 25%. But that shouldn't make a very big difference and doesn't explain the big write performance difference.
 
Last edited:
I'd test a different storage, preferably ramdisk and try to figure out if there is a difference.
This would confirm two things (or rule them out)
- is it related to iscsi (perhaps through offloading issue, the r510 is a dinasaur ;))?
- is it solely related to zfs?
 

About

The Proxmox community has been around for many years and offers help and support for Proxmox VE, Proxmox Backup Server, and Proxmox Mail Gateway.
We think our community is one of the best thanks to people like you!

Get your subscription!

The Proxmox team works very hard to make sure you are running the best software and getting stable updates and security enhancements, as well as quick enterprise support. Tens of thousands of happy customers have a Proxmox subscription. Get yours easily in our online shop.

Buy now!