Windows 10 VM Ballooning -> almost 100% Ram usage

rumble06

New Member
Jul 12, 2019
14
1
1
24
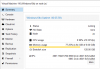
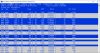
After enabling ballooning and following the wiki (installed drivers and got ballooningservice to run on windows) instead of the RAM Usage going lower inside the proxmox panel, instead the RAM went up inside the VM. Minimum RAM: 2048MB, Total Ram allocated to the VM: 14336MB. However, usage is at 90% now not only on the proxmox panel but on the VM Task Manager too.

Edit: Uninstall the ballooningservice or stopping it didn't helped, the RAM usage was still over 90% all the time (even right after the boot), which is over 12GB out of the 14GB allocated to the VM.
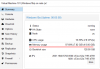
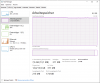
But, after I pressed "Uninstall device" on the Virtio Ballooning from device manager the problem was fixed, current RAM usage is only 2.5GB inside the VM (however the proxmox is not reporting that, that's why I want to use the ballooning service).

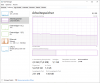
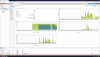
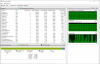
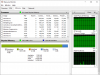
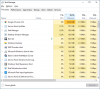
Edit2: It seems like there is a memory leak on the ballooning win10 driver. After I installed the driver again I checked task manager, ram usage is +100MB every 3-4 seconds and it won't stop.
 

Attachments

  • Windows10Ballooning.png
    Windows10Ballooning.png
    35.9 KB · Views: 157
  • Windows10Ballooning2.png
    Windows10Ballooning2.png
    38.2 KB · Views: 149
Last edited:
which version of virtio drivers are you using
 
I have the same problem in Windows 10 1909, just freshly installed.

I tried the latest (1.173), as well as the stable version (1.171) and I made sure that the ballooning service was running and drivers installed. Still, I get increasing RAM usage when the service is running.

Another problem I faced with two Windows 10 machines and ballooning enabled: Proxmox completely froze and reset with the following settings and when both VMs were started:

VM1: 2GB min RAM, 8GB max RAM
VM2: 4GB min RAM, 16GB max RAM

I have 16GB of system memory and no other VMs running, so I expected this to work. Ballooning was enabled for both, and the ballooning service was running (drivers also installed). RAM usage was correctly reported for both machines in the proxmox web interface, when run individually.
 
What's in your syslog? I would guess that your host ran out off memory and that's why it crashed.
If you have only 16GB memory total and one of your VMs is allowed to take all that memory it isn't surprising that your host struggles.
 
The machines in idle only take up around 3GB of RAM, so from the guest side, RAM usage was not excessive. Is ballooning not supposed to manage RAM, so I can overprovision it?

If ballooning is enabled in the Proxmox web-GUI, there seems to be a memory leak and every 3-4 seconds, RAM usage increases within Windows by 100 MB. I found out that even after disabling the ballooning service, this behaviour persists, thus I assume the ballooning driver to be the reason for the memory leak. Disabling ballooning in the GUI also stops the memory leaks.

I will later check the syslog.
 
The machines in idle only take up around 3GB of RAM, so from the guest side, RAM usage was not excessive. Is ballooning not supposed to manage RAM, so I can overprovision it?
It is, but you told us that ballooning isn't working inside your VM for whatever reason therefor it is probably not working as expected.
Without logs and stats from that time it's hard to say anything about it.
 
Ok, I will soon return with more information. Could you point me to relevant log files apart from syslog?
 
The testing configuration was as follows:

VM1/VM2 each have min. 2GB RAM and max. 8GB RAM set with ballooning enabled. Reporting of RAM usage to the Proxmox user interface is working correctly, meaning that Windows and Proxmox RAM usage display is consistent. RAM usage drops slowly from 90% over time, until it reaches a normal level.

However, when one machine is running (idling with around 3 GB used RAM), starting the second one still crashed Proxmox completely. The syslog does not show any additional output when the crash happens, when watched with "tail -f /var/log/syslog" over ssh, as well as from the shell in the web interface on the client VM. With and without ballooning, the contents of the syslog on launch of a VM are the same. Unfortunately, I missed to capture it and will do so later.
 

Attachments

  • ram.PNG
    ram.PNG
    39.8 KB · Views: 82
  • stats.PNG
    stats.PNG
    251.1 KB · Views: 77
When both machines are running with more conservative memory settings (VM1: 1-8 GB RAM, VM2: 1-6 GB RAM, so no overprovisioning), this is what I get from "free -h" after some idling period of 5 minutes and with ballooning enabled:

Bash:
root@pc:~# free -h
              total        used        free      shared  buff/cache   available
Mem:           15Gi        14Gi       208Mi        17Mi       461Mi       316Mi
Swap:         8.0Gi       545Mi       7.5Gi

It does not look like there is a lot of memory available to the host.

I also do not understand why the host crashes in case of overprovisioning, even if no RAM was available. There is still enough swap space for it to use.

Find the stats of the two VMs (vm1.png/vm2.png) attached. Both are running with ballooning and RAM reporting is accurate. "BLNSRV.exe" is present as a process in task manager in both, and the Ballooning driver is also visible in device manager and running fine.

The syslog when running these two VMs is attached.

I noticed that the Windows VMs become slow to react when the RAM is as full as it is with these settings (see ram.png).

For completeness, find the configuration settings here:

VM1:
Bash:
root@pc:~# qm config 101
agent: 1
balloon: 1024
bios: ovmf
boot: cdn
bootdisk: scsi0
cores: 8
cpu: host
efidisk0: local-lvm:vm-101-disk-1,size=128K
hostpci0: 0a:00,x-vga=1,pcie=1,romfile=GTX1070.bin
hostpci1: 0b:00.3,pcie=1
machine: q35
memory: 8192
name: Windows10a
net0: virtio=F6:FB:DE:3A:E5:8B,bridge=vmbr0,firewall=1
numa: 1
onboot: 1
ostype: win10
scsi0: local-lvm:vm-101-disk-0,backup=0,cache=writeback,iothread=1,size=128G,ssd=1
scsi2: /dev/disk/by-id/ata-CT2000MX500SSD1_1825E144C0C8,size=1953514584K
scsihw: virtio-scsi-single
smbios1: uuid=272870d3-f14e-4ae2-b9b9-a47e1b6ecd4b
sockets: 1
vga: none
vmgenid: b5558763-7896-4b51-bff3-ad1cc7627879

VM2
Bash:
root@pc:~# qm config 110
agent: 1
balloon: 1024
bios: ovmf
bootdisk: scsi0
cores: 8
cpu: host
efidisk0: local-lvm:vm-102-disk-1,size=128K
hostpci0: 01:00,pcie=1,x-vga=1
machine: q35
memory: 6144
name: Windows10b
net0: virtio=CE:21:FB:FA:E2:41,bridge=vmbr0,firewall=1
numa: 1
ostype: win10
scsi0: local-lvm:vm-102-disk-0,backup=0,cache=writeback,iothread=1,size=128G,ssd=1
scsihw: virtio-scsi-single
smbios1: uuid=b8d50aee-0211-4e45-ae22-b284360bbf0c
sockets: 1
usb0: host=0416:0123
usb1: host=feed:2260,usb3=1
usb2: host=1532:0016
vga: none
vmgenid: 3b7dd095-86d4-4712-9ea6-4f18ee215381

Do you have some ideas where to look next?
 

Attachments

  • vm2.PNG
    vm2.PNG
    20.9 KB · Views: 41
  • vm1.PNG
    vm1.PNG
    20.8 KB · Views: 39
  • syslog.txt
    13.9 KB · Views: 10
  • ram.PNG
    ram.PNG
    39.9 KB · Views: 36
That's not the syslog from the crash, that's just an excerpt from when you started both VM's. What's using the memory in your VM?
 
Yes, it is not from the crash, I will record another one when it crashes in the evening.

In the list of tasks, there is no process that uses much memory at all. I cannot see the source of memory consumption. Blnsrv.exe also uses very little, in the order of 1 MB. I will also post a screenshot of the process list when I have the chance.

Are there hidden processes that the task manager does not show by default?

Edit: I will have a look at the resource monitor.
 
Last edited:
I actually don't know if this is the case for windows, but I guess it could be that some processes are hidden or do not adhere to the task manager protocol or so.

Aren't the syslog files from the last crash still available?
 
I actually don't know if this is the case for windows, but I guess it could be that some processes are hidden or do not adhere to the task manager protocol or so.

Yes, I will try and check the resource monitor that should also include system processes that I cannot see in Task manager.

Aren't the syslog files from the last crash still available?

Maybe, but I don't know which one it is in the log rotation. I will just let it crash again.
 
Find a crash syslog attached. Here, one VM was rebooted with "unsafe" settings, meaning 1GB min. RAM and 12GB max. RAM, while the other machine has 2GB min. RAM and 6GB max. RAM. The reboot happens here:

Code:
Jan  9 18:35:52 pc qmeventd[874]: Restarting VM 101

Anyway, I cannot see anything useful in this log. After 18:36:00, the logs continue after rebooting.

In resmon/poolmon, I cannot see any excessive ram usage from processes or drivers at all.
 

Attachments

  • poolmon.PNG
    poolmon.PNG
    51.5 KB · Views: 37
  • resmon.PNG
    resmon.PNG
    71.9 KB · Views: 35
  • syslog.txt
    4.8 KB · Views: 7
This is again just a small part of the syslog, without any information about a crash.
 
I understand your concern but it is all the syslog I have. During the crash, nothing is added. I got this with "cat /var/log/syslog" after reboot.
 
Just to make this clear, we are still talking about the Proxmox host crashing?

AFAICS this was "tail" not "cat" and I doubt that there is nothing more in your syslog then 55 lines starting a 6 p.m.
 
The system behaviour is like this: I reboot the offending VM with memory settings that lead to overprovisioning, everything freezes (VMs, web GUI, SSH becomes unreactive), and the proxmox host reboots.

I then extracted the syslog after the forced reboot, which, of course, is very long. You are correct, I used tail and this is not the complete syslog. Sorry for the confusion. Still, I posted the part that includes everything between these two events:

Code:
Jan  9 18:35:46 pc pvedaemon[6712]: requesting reboot of VM 101: UPID:pc:00001A38:00021DA5:5E176472:qmreboot:101:root@pam:

This is where VM 101 was restarted with changed settings, so that RAM is overprovisioned. The logs continue until

Code:
Jan  9 18:36:00 pc systemd[1]: Starting Proxmox VE replication runner...

which is the last line that syslog contains before the system is rebooted due to the crash.

The next line came a few minutes later and contains proxmox startup messages. I feel like I should have included those lines too to avoid the miscommunication, so please excuse this. Currently, I do not have access to the machine, so I cannot attach the rest.

As I mentioned, during the actual crash, no lines are added to the syslog, the system just stops.
 
Hi there,
I think I'm having the same problem.
I see that just like me, you are doing gpu passthrough on your vm while trying to do a memory ballooning.

If you only start 1 vm with ballooning (with safe number), and compare the memory used from inside the vm to the memory used from proxmox, does the memory ever decrease or it always stay at the maximum ballooning?
Also could you redo the same test but without gpu passthrough see if it's working?
 
The thing is, qemu needs to allocate the whole memory up front if you use gpu passthrough, because of the memory mapping required for this.
 

About

The Proxmox community has been around for many years and offers help and support for Proxmox VE, Proxmox Backup Server, and Proxmox Mail Gateway.
We think our community is one of the best thanks to people like you!

Get your subscription!

The Proxmox team works very hard to make sure you are running the best software and getting stable updates and security enhancements, as well as quick enterprise support. Tens of thousands of happy customers have a Proxmox subscription. Get yours easily in our online shop.

Buy now!