VM stuck starting, unable to stop process or reboot host

JJ White

New Member
May 5, 2024
8
0
1
Hi all,

My setup:
  • Proxmox VE 8.4.1
  • Intel Atom J4105
  • 32GB
  • Several VMs and containers
  • Boot mode: EFI

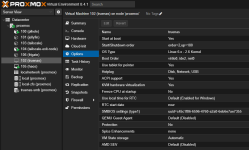
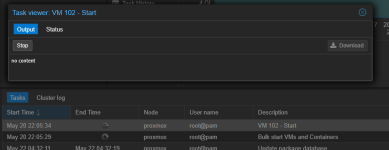
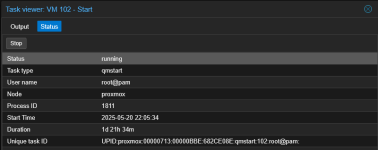
I have recently been having the following issue on my TrueNAS VM (102) with PCIe passthrough of the SATA controllers. When Proxmox starts, it attempts to automatically start VM102 because "Start at boot" is enabled. However, the startup task never finishes, not even after several days. Selecting the task and clicking "stop" has no effect...

Additionally, rebooting the host system no longer works via the GUI or by using "systemctl --force --force reboot" on the CLI. When I forcefully reboot it by unplugging the cable, I get stuck with the same problem again on the next boot.

A month ago I had the same issue, then I installed all updates and power cycled which appeared to have fixed the issue. I assumed the issue was resolved with the update, but now the same problem is back and I'm already fully up to date, so I have no clue what is causing this problem.

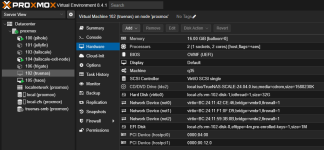
VM configuration:
pm2.PNG
pm3.PNG

Tasks:
pm.PNG
pm4.PNG

pm5.PNG
pm6.PNG
 
Last edited:
@dherzig I failed to mention in my post that this setup has been working flawlessly for over a year before I started having this problem, so I'm pretty sure it is powerful enough to perform the task I'm asking of it. PCI passthrough has also worked fine for all this time, and even transcoding on the iGPU is working inside an LXC container.

I'm not sure what has changed and I could not find a way to see what step the initialization is hung on, as there is no output from the task.

I am aware the Intel ARK shows this CPU supporting only 8GB or DDR4, but Intel has a habit of under representing these Atoms on their website for some reason. I have been running 32GB without issue:

Bash:
root@proxmox:~# free -h
dmidecode -t memory
               total        used        free      shared  buff/cache   available
Mem:            30Gi       7.5Gi        18Gi        60Mi       5.2Gi        23Gi
Swap:             0B          0B          0B
# dmidecode 3.4
Getting SMBIOS data from sysfs.
SMBIOS 3.1.1 present.

Handle 0x000B, DMI type 16, 23 bytes
Physical Memory Array
        Location: System Board Or Motherboard
        Use: System Memory
        Error Correction Type: None
        Maximum Capacity: 256 GB
        Error Information Handle: Not Provided
        Number Of Devices: 2

Handle 0x000D, DMI type 17, 40 bytes
Memory Device
        Array Handle: 0x000B
        Error Information Handle: Not Provided
        Total Width: 64 bits
        Data Width: 64 bits
        Size: 16 GB
        Form Factor: SODIMM
        Set: None
        Locator: A1_DIMM0
        Bank Locator: A1_BANK0
        Type: DDR4
        Type Detail: Synchronous
        Speed: 2400 MT/s
        Manufacturer: Samsung         
        Serial Number: 37230921 
        Asset Tag: 9876543210     
        Part Number: M471A2K43CB1-CTD 
        Rank: 2
        Configured Memory Speed: 2400 MT/s
        Minimum Voltage: 1.5 V
        Maximum Voltage: 1.5 V
        Configured Voltage: 1.5 V

Handle 0x000F, DMI type 17, 40 bytes
Memory Device
        Array Handle: 0x000B
        Error Information Handle: Not Provided
        Total Width: 64 bits
        Data Width: 64 bits
        Size: 16 GB
        Form Factor: SODIMM
        Set: None
        Locator: B1_DIMM0
        Bank Locator: B1_BANK0
        Type: DDR4
        Type Detail: Synchronous
        Speed: 2400 MT/s
        Manufacturer: Undefined       
        Serial Number: 24101522 
        Asset Tag: 9876543210     
        Part Number: CT16G4SFRA266.M16F
        Rank: 2
        Configured Memory Speed: 2400 MT/s
        Minimum Voltage: 1.5 V
        Maximum Voltage: 1.5 V
        Configured Voltage: 1.5 V
 
Hi JJ White,

for debugging purposes it could be helpful, if your remove the 'Start on Boot' Option from your VM. Then powercycle your Host, so we do not have the hanging processes after startup anymore.

You could then get the command your VM ist started with by running:
Code:
qm showcmd 102

Once you have this command, run it directly -- ideally from an ssh-session.

What does the output show?
 
Can you also show your IOMMU groups? Maybe something changed and you're now passing the wrong thing. I'd recommend mapping your devices.
Bash:
#!/bin/bash
shopt -s nullglob
for g in $(find /sys/kernel/iommu_groups/* -maxdepth 0 -type d | sort -V); do
    echo "IOMMU Group ${g##*/}:"
    for d in $g/devices/*; do
        echo -e "\t$(lspci -nns ${d##*/})"
    done;
done;
 
Last edited:
  • Like
Reactions: dherzig
Hi JJ White,

for debugging purposes it could be helpful, if your remove the 'Start on Boot' Option from your VM. Then powercycle your Host, so we do not have the hanging processes after startup anymore.

You could then get the command your VM ist started with by running:
Code:
qm showcmd 102

Once you have this command, run it directly -- ideally from an ssh-session.

What does the output show?
Apologies for the late response and thanks for the tip, that does indeed provide more output:

Code:
root@proxmox:~# /usr/bin/kvm -id 102 -name 'truenas,debug-threads=on'
...
-device 'vfio-pci,host=0000:04:00.0,id=hostpci0,bus=pci.0,addr=0x10' -device 'vfio-pci,host=0000:00:12.0,id=hostpci1
...
kvm: -device vfio-pci,host=0000:00:12.0,id=hostpci1,bus=pci.0,addr=0x11: vfio 0000:00:12.0: Could not open '/dev/vfio/4': No such file or directory
root@proxmox:~#

Looks like some problem with passing through a PCIe device. When I check with lspci, device 12 is still the SATA controller it always was.

Can you also show your IOMMU groups? Maybe something changed and you're now passing the wrong thing. I'd recommend mapping your devices.
Bash:
#!/bin/bash
shopt -s nullglob
for g in $(find /sys/kernel/iommu_groups/* -maxdepth 0 -type d | sort -V); do
    echo "IOMMU Group ${g##*/}:"
    for d in $g/devices/*; do
        echo -e "\t$(lspci -nns ${d##*/})"
    done;
done;

Running your script shows the PCH SATA controller is still in its own IOMMU group, as far as my understanding of IOMMU groups goes that should be perfect.

Code:
root@proxmox:~# ./show_iommu.sh
IOMMU Group 0:
        00:02.0 VGA compatible controller [0300]: Intel Corporation GeminiLake [UHD Graphics 600] [8086:3185] (rev 03)
IOMMU Group 1:
        00:00.0 Host bridge [0600]: Intel Corporation Gemini Lake Host Bridge [8086:31f0] (rev 03)
        00:00.1 Signal processing controller [1180]: Intel Corporation Celeron/Pentium Silver Processor Dynamic Platform and Thermal Framework Processor Participant [8086:318c] (rev 03)
IOMMU Group 2:
        00:0e.0 Audio device [0403]: Intel Corporation Celeron/Pentium Silver Processor High Definition Audio [8086:3198] (rev 03)
IOMMU Group 3:
        00:0f.0 Communication controller [0780]: Intel Corporation Celeron/Pentium Silver Processor Trusted Execution Engine Interface [8086:319a] (rev 03)
IOMMU Group 4:
        00:12.0 SATA controller [0106]: Intel Corporation Celeron/Pentium Silver Processor SATA Controller [8086:31e3] (rev 03)
IOMMU Group 5:
        00:13.0 PCI bridge [0604]: Intel Corporation Gemini Lake PCI Express Root Port [8086:31d8] (rev f3)
IOMMU Group 6:
        00:13.1 PCI bridge [0604]: Intel Corporation Gemini Lake PCI Express Root Port [8086:31d9] (rev f3)
IOMMU Group 7:
        00:13.2 PCI bridge [0604]: Intel Corporation Gemini Lake PCI Express Root Port [8086:31da] (rev f3)
IOMMU Group 8:
        00:13.3 PCI bridge [0604]: Intel Corporation Gemini Lake PCI Express Root Port [8086:31db] (rev f3)
IOMMU Group 9:
        00:15.0 USB controller [0c03]: Intel Corporation Celeron/Pentium Silver Processor USB 3.0 xHCI Controller [8086:31a8] (rev 03)
IOMMU Group 10:
        00:1f.0 ISA bridge [0601]: Intel Corporation Celeron/Pentium Silver Processor LPC Controller [8086:31e8] (rev 03)
        00:1f.1 SMBus [0c05]: Intel Corporation Celeron/Pentium Silver Processor Gaussian Mixture Model [8086:31d4] (rev 03)
IOMMU Group 11:
        02:00.0 SATA controller [0106]: JMicron Technology Corp. JMB58x AHCI SATA controller [197b:0585]
IOMMU Group 12:
        03:00.0 Ethernet controller [0200]: Realtek Semiconductor Co., Ltd. RTL8111/8168/8411 PCI Express Gigabit Ethernet Controller [10ec:8168] (rev 15)
IOMMU Group 13:
        04:00.0 SATA controller [0106]: ASMedia Technology Inc. ASM1062 Serial ATA Controller [1b21:0612] (rev 02)

After looking around for similar posts with vfio problems, I came across this one where the fix was disabling "All functions" on the PCI device in the hardware menu. Mine was already set to disabled so I enabled it and wouldn't you know, now it boots fine...

I don't remember ever changing this function after creating the VM, so no idea when this went wrong but I think I can now mark this thread as solved.

Thanks a bunch for the input!

edit: Just tried another reboot to verify... aaaand it's stuck again...

Running the qm start command again now shows the other PCI device being the problem:

Code:
kvm: -device vfio-pci,host=0000:04:00.0,id=hostpci0,bus=pci.0,addr=0x10: vfio 0000:04:00.0: Could not open '/dev/vfio/13': No such file or directory

However, that one already has "All functions enabled", so I'm royally confused.
 
Last edited:
Tried some more troubleshooting today, without success.

Removing both PCI passthrough devices makes the VM boot, so I can be sure the problem is to do with those.
I re-checked the PCIe passthrough guide to see if any settings got reset, but all settings are still showing as they should (VFIO and IOMMU enabled and all)
Also ran another update and rebooted, but also that didn't do anything.

Maybe tomorrow I will try to reset and reconfigure the BIOS to see if the problem originates there, but I'm assuming if DMESG says IOMMU is enabled it is enabled in the BIOS as well.
 
A lot more troubleshooting today, again without success.

I checked the BIOS, vt-d was still enabled and I disabled PCI ACPI just in case. The first boot after passthrough worked again, but the very next it was broker again. Just to be sure I replaced the CMOS battery, but that didn't change anything.

I unplugged the drives from both the PSU and SATA controllers, to see if the power supply or SATA was causing problems. But again, no change and the TrueNAS VM fails to boot stating it cannot find the VFIO file for one of the controllers.

Only clue I have that something might be wrong, but maybe this is normal when the VM is not booted, is that it shows the ahci driver is loaded for both SATA controllers I want to pass through. Looking at the GPU passthrough guide this should read " vfio-pci" I think.

Code:
00:12.0 SATA controller [0106]: Intel Corporation Celeron/Pentium Silver Processor SATA Controller [8086:31e3] (rev 03)
    Subsystem: ASRock Incorporation Celeron/Pentium Silver Processor SATA Controller [1849:31e3]
    Kernel modules: ahci
04:00.0 SATA controller [0106]: ASMedia Technology Inc. ASM1062 Serial ATA Controller [1b21:0612] (rev 02)
    Subsystem: ASRock Incorporation Motherboard [1849:0612]
    Kernel driver in use: ahci
    Kernel modules: ahci

To try and combat this I created a modprobe config as shown in the PCIe passthrough guide:

Code:
root@proxmox:~# cat /etc/modprobe.d/vfio-pci-ids.conf
options vfio-pci ids=8086:31e3,1b21:0612

But after updating the initramfs and rebooting, I see no change. The other option in the guide is blacklisting the whole driver, but I expect this would break my install by also blocking the ahci driver for my boot drives connected to a third SATA controller.

edit: I did spy some crash dumps on the dmesg output related to SATA and VFIO, anybody know how to interpret this?

Code:
[  246.984066] INFO: task kworker/0:2:153 blocked for more than 122 seconds.
[  246.984107]       Tainted: P           O       6.8.12-11-pve #1
[  246.984125] "echo 0 > /proc/sys/kernel/hung_task_timeout_secs" disables this message.
[  246.984145] task:kworker/0:2     state:D stack:0     pid:153   tgid:153   ppid:2      flags:0x00004000
[  246.984178] Workqueue: pm pm_runtime_work
[  246.984199] Call Trace:
[  246.984209]  <TASK>
[  246.984221]  __schedule+0x42b/0x1500
[  246.984239]  ? start_flush_work+0x268/0x310
[  246.984256]  schedule+0x33/0x110
[  246.984270]  ata_port_wait_eh+0x79/0x100
[  246.984286]  ? __pfx_autoremove_wake_function+0x10/0x10
[  246.984304]  ata_port_request_pm+0x137/0x160
[  246.984320]  ? __pfx_ata_port_runtime_suspend+0x10/0x10
[  246.984336]  ? __pfx_ata_port_runtime_suspend+0x10/0x10
[  246.984351]  ata_port_runtime_suspend+0x34/0x50
[  246.984365]  __rpm_callback+0x4d/0x170
[  246.984380]  ? __pfx_ata_port_runtime_suspend+0x10/0x10
[  246.984395]  rpm_callback+0x6d/0x80
[  246.984408]  ? __pfx_ata_port_runtime_suspend+0x10/0x10
[  246.984423]  rpm_suspend+0x122/0x6b0
[  246.984438]  ? __pfx_ata_port_runtime_idle+0x10/0x10
[  246.984455]  rpm_idle+0x1dc/0x2b0
[  246.984468]  pm_runtime_work+0xa3/0xe0
[  246.984483]  process_one_work+0x17f/0x3a0
[  246.984497]  worker_thread+0x306/0x440
[  246.984511]  ? __pfx_worker_thread+0x10/0x10
[  246.984526]  kthread+0xef/0x120
[  246.984539]  ? __pfx_kthread+0x10/0x10
[  246.984554]  ret_from_fork+0x44/0x70
[  246.984570]  ? __pfx_kthread+0x10/0x10
[  246.984584]  ret_from_fork_asm+0x1b/0x30
[  246.984601]  </TASK>
[  246.984654] INFO: task task UPID:proxm:2191 blocked for more than 122 seconds.
[  246.984676]       Tainted: P           O       6.8.12-11-pve #1
[  246.984693] "echo 0 > /proc/sys/kernel/hung_task_timeout_secs" disables this message.
[  246.984713] task:task UPID:proxm state:D stack:0     pid:2191  tgid:2191  ppid:1677   flags:0x00004002
[  246.984742] Call Trace:
[  246.984750]  <TASK>
[  246.984758]  __schedule+0x42b/0x1500
[  246.984773]  ? down_write+0x12/0x80
[  246.984786]  ? __call_rcu_common+0xf9/0x780
[  246.984802]  schedule+0x33/0x110
[  246.984816]  __pm_runtime_barrier+0xa0/0x170
[  246.984832]  ? __pfx_autoremove_wake_function+0x10/0x10
[  246.984849]  __pm_runtime_disable+0xee/0x170
[  246.984865]  pm_runtime_remove+0x16/0x90
[  246.984881]  device_pm_remove+0x84/0xf0
[  246.984894]  device_del+0x169/0x3e0
[  246.984909]  ata_tport_delete+0x2d/0x50
[  246.984923]  ata_port_detach+0x255/0x320
[  246.984942]  ata_pci_remove_one+0x2e/0x50
[  246.984956]  ahci_remove_one+0x31/0x50 [ahci]
[  246.984986]  pci_device_remove+0x3e/0xb0
[  246.985003]  device_remove+0x40/0x80
[  246.985018]  device_release_driver_internal+0x20b/0x270
[  246.985036]  ? bus_find_device+0xb8/0xf0
[  246.985051]  device_driver_detach+0x14/0x20
[  246.985065]  unbind_store+0xac/0xc0
[  246.985078]  drv_attr_store+0x21/0x50
[  246.985091]  sysfs_kf_write+0x3b/0x60
[  246.985105]  kernfs_fop_write_iter+0x130/0x210
[  246.985121]  vfs_write+0x2a5/0x480
[  246.985137]  ksys_write+0x73/0x100
[  246.985151]  __x64_sys_write+0x19/0x30
[  246.985165]  x64_sys_call+0x200f/0x2480
[  246.985177]  do_syscall_64+0x81/0x170
[  246.985192]  ? count_memcg_events.constprop.0+0x2a/0x50
[  246.985210]  ? handle_mm_fault+0xad/0x380
[  246.985224]  ? do_user_addr_fault+0x33f/0x660
[  246.985239]  ? irqentry_exit_to_user_mode+0x7b/0x260
[  246.985258]  ? irqentry_exit+0x43/0x50
[  246.985273]  ? clear_bhb_loop+0x15/0x70
[  246.985287]  ? clear_bhb_loop+0x15/0x70
[  246.985300]  ? clear_bhb_loop+0x15/0x70
[  246.985313]  entry_SYSCALL_64_after_hwframe+0x78/0x80
[  246.985328] RIP: 0033:0x7092b4a63300
[  246.985367] RSP: 002b:00007ffd53e59568 EFLAGS: 00000202 ORIG_RAX: 0000000000000001
[  246.985391] RAX: ffffffffffffffda RBX: 00005871b5fe32a0 RCX: 00007092b4a63300
[  246.985410] RDX: 000000000000000c RSI: 00005871bdfea370 RDI: 000000000000000f
[  246.985429] RBP: 0000000000000048 R08: 0000000000000001 R09: 00005871bdff8390
[  246.985447] R10: 8d58ae4720139d8b R11: 0000000000000202 R12: 00005871bdfd9f48
[  246.985465] R13: 000000000000000f R14: 00005871bdfd9f38 R15: 0000000000000000
[  246.985486]  </TASK>
 
Last edited:
Your `dmesg` shows that two processes (153, 2191) went into uninterruptible sleep (D) state. When did you catch these messages? Right after starting up the VM?

If you didn't reboot in the meantime, you could try identifying them by running:
Code:
ps lp 153 2191

You'll need to reboot your host to get rid of these afterwards.

To ease iterative tuning, especially with multiple pass-through devices, you might want to use resource mapping [0] as @Impact mentioned.

[0] https://pve.proxmox.com/pve-docs/pve-admin-guide.html#resource_mapping

The dmesg entries are from 246 seconds after boot, when I had the problematic VM set to auto start on boot. I haven't rebooted since, so the two processes are:

Code:
root@proxmox:~# ps lp 153 2191
F   UID     PID    PPID PRI  NI    VSZ   RSS WCHAN  STAT TTY        TIME COMMAND
1     0     153       2  20   0      0     0 ata_po D    ?          0:00 [kworker/0:2+pm]
5     0    2191    1677  20   0 257968 139508 pm_run Ds  ?          0:00 task UPID:proxmox:0000088F:00000E7F:683CABE9:qmstart:102:root@pam:

I've added both SATA controllers as mapped devices using the GUI and updated the VM hardware config to use them instead of directly linking the PCIe device:

mapping.PNG

Then I rebooted the system (waiting for it to hang on shutdown due to the blocked tasks, then yanking the plug). After reboot I tried to start vm102 manually to see what was being printed in dmesg. I see that it immediately tries to sync "sda" and enter standy, after which it stays silent for a while until the crash dump is logged:

Code:
[  760.944887] sd 0:0:0:0: [sda] Synchronizing SCSI cache
[  760.947839] ata1.00: Entering standby power mode
[  984.030197] INFO: task kworker/2:2:191 blocked for more than 122 seconds.
[  984.031829]       Tainted: P           O       6.8.12-11-pve #1
[  984.033465] "echo 0 > /proc/sys/kernel/hung_task_timeout_secs" disables this message.
[  984.035079] task:kworker/2:2     state:D stack:0     pid:191   tgid:191   ppid:2      flags:0x00004000
[  984.036754] Workqueue: pm pm_runtime_work
[  984.038470] Call Trace:
[  984.040172]  <TASK>
[  984.041908]  __schedule+0x42b/0x1500
[  984.043566]  ? start_flush_work+0x268/0x310
[  984.045284]  schedule+0x33/0x110
[  984.046922]  ata_port_wait_eh+0x79/0x100
[  984.048541]  ? __pfx_autoremove_wake_function+0x10/0x10
[  984.050175]  ata_port_request_pm+0x137/0x160
[  984.051806]  ? __pfx_ata_port_runtime_suspend+0x10/0x10
[  984.053443]  ? __pfx_ata_port_runtime_suspend+0x10/0x10
[  984.055078]  ata_port_runtime_suspend+0x34/0x50
[  984.056722]  __rpm_callback+0x4d/0x170
[  984.058459]  ? __pfx_ata_port_runtime_suspend+0x10/0x10
[  984.060190]  rpm_callback+0x6d/0x80
[  984.061900]  ? __pfx_ata_port_runtime_suspend+0x10/0x10
[  984.063606]  rpm_suspend+0x122/0x6b0
[  984.065319]  ? __pfx_ata_port_runtime_idle+0x10/0x10
[  984.067001]  rpm_idle+0x1dc/0x2b0
[  984.068662]  pm_runtime_work+0xa3/0xe0
[  984.070326]  process_one_work+0x17f/0x3a0
[  984.071993]  worker_thread+0x306/0x440
[  984.073664]  ? __pfx_worker_thread+0x10/0x10
[  984.075340]  kthread+0xef/0x120
[  984.077014]  ? __pfx_kthread+0x10/0x10
[  984.078697]  ret_from_fork+0x44/0x70
[  984.080332]  ? __pfx_kthread+0x10/0x10
[  984.081970]  ret_from_fork_asm+0x1b/0x30
[  984.083617]  </TASK>
[  984.085312] INFO: task task UPID:proxm:8285 blocked for more than 122 seconds.
[  984.086971]       Tainted: P           O       6.8.12-11-pve #1
[  984.088637] "echo 0 > /proc/sys/kernel/hung_task_timeout_secs" disables this message.
[  984.090317] task:task UPID:proxm state:D stack:0     pid:8285  tgid:8285  ppid:1642   flags:0x00004002
[  984.092026] Call Trace:
[  984.093733]  <TASK>
[  984.095439]  __schedule+0x42b/0x1500
[  984.097192]  ? __call_rcu_common+0xf9/0x780
[  984.098961]  schedule+0x33/0x110
[  984.100729]  __pm_runtime_barrier+0xa0/0x170
[  984.102470]  ? __pfx_autoremove_wake_function+0x10/0x10
[  984.104201]  __pm_runtime_disable+0xee/0x170
[  984.106008]  pm_runtime_remove+0x16/0x90
[  984.107738]  device_pm_remove+0x84/0xf0
[  984.109471]  device_del+0x169/0x3e0
[  984.111231]  ata_tport_delete+0x2d/0x50
[  984.112959]  ata_port_detach+0x255/0x320
[  984.114696]  ata_pci_remove_one+0x2e/0x50
[  984.116435]  ahci_remove_one+0x31/0x50 [ahci]
[  984.118183]  pci_device_remove+0x3e/0xb0
[  984.119932]  device_remove+0x40/0x80
[  984.121679]  device_release_driver_internal+0x20b/0x270
[  984.123436]  ? bus_find_device+0xb8/0xf0
[  984.125188]  device_driver_detach+0x14/0x20
[  984.126977]  unbind_store+0xac/0xc0
[  984.128797]  drv_attr_store+0x21/0x50
[  984.130652]  sysfs_kf_write+0x3b/0x60
[  984.132502]  kernfs_fop_write_iter+0x130/0x210
[  984.134360]  vfs_write+0x2a5/0x480
[  984.136174]  ksys_write+0x73/0x100
[  984.137937]  __x64_sys_write+0x19/0x30
[  984.139706]  x64_sys_call+0x200f/0x2480
[  984.141472]  do_syscall_64+0x81/0x170
[  984.143248]  ? syscall_exit_to_user_mode+0x86/0x260
[  984.145056]  ? do_syscall_64+0x8d/0x170
[  984.146835]  ? __count_memcg_events+0x6f/0xe0
[  984.148619]  ? count_memcg_events.constprop.0+0x2a/0x50
[  984.150415]  ? handle_mm_fault+0xad/0x380
[  984.152209]  ? do_user_addr_fault+0x33f/0x660
[  984.154009]  ? irqentry_exit_to_user_mode+0x7b/0x260
[  984.155824]  ? irqentry_exit+0x43/0x50
[  984.157641]  ? clear_bhb_loop+0x15/0x70
[  984.159452]  ? clear_bhb_loop+0x15/0x70
[  984.161292]  ? clear_bhb_loop+0x15/0x70
[  984.163096]  entry_SYSCALL_64_after_hwframe+0x78/0x80
[  984.164907] RIP: 0033:0x7d3a5f740300
[  984.166788] RSP: 002b:00007ffedcc9d6c8 EFLAGS: 00000202 ORIG_RAX: 0000000000000001
[  984.168627] RAX: ffffffffffffffda RBX: 00005f97821142a0 RCX: 00007d3a5f740300
[  984.170470] RDX: 000000000000000c RSI: 00005f978ab94850 RDI: 000000000000000d
[  984.172317] RBP: 0000000000000030 R08: 0000000000000001 R09: 00005f978ac44500
[  984.174201] R10: 32c930191acabdbc R11: 0000000000000202 R12: 00005f978a7cb8e0
[  984.176054] R13: 000000000000000d R14: 00005f978a7cb8d0 R15: 0000000000000000
[  984.177969]  </TASK>

"sda" is one of the HDDs connected to the SATA controllers I'm passing through, is it possible that some process on the host is using this drive and thereby blocking it for releasing the PCI device? I did notice some very light HDD activity even with the VM shut down, which could support this. I'm not sure how to check this, but the drives do show in "lsblk", but I do not see them in "/proc/mounts" as being mounted somewhere.
 
Mhm. Difficult to say. Does any of these commands reference /dev/sda?

Code:
cat /etc/fstab
pvs
zpool status
 
@dherzig sda, sdb, sde and sdf are the HDDs connected to the SATA controllers to be passed through, they do not show in any output for your commands:

Code:
root@proxmox:~# cat /etc/fstab
# <file system> <mount point> <type> <options> <dump> <pass>
proc /proc proc defaults 0 0
root@proxmox:~# pvs
root@proxmox:~# zpool status
  pool: rpool
 state: ONLINE
  scan: scrub repaired 0B in 00:06:23 with 0 errors on Sun May 11 00:30:24 2025
config:

        NAME                                                  STATE     READ WRITE CKSUM
        rpool                                                 ONLINE       0     0     0
          mirror-0                                            ONLINE       0     0     0
            ata-Micron_1300_MTFDDAK1T0TDL_1915218806F5-part3  ONLINE       0     0     0
            ata-Micron_1300_MTFDDAK1T0TDL_191521880673-part3  ONLINE       0     0     0

errors: No known data errors
root@proxmox:~# ls -la /dev/disk/by-id/ | grep ata
lrwxrwxrwx 1 root root   9 Jun  2 13:57 ata-HGST_HUH721212ALE600_5PKMPLHE -> ../../sde
lrwxrwxrwx 1 root root  10 Jun  2 13:57 ata-HGST_HUH721212ALE600_5PKMPLHE-part1 -> ../../sde1
lrwxrwxrwx 1 root root  10 Jun  2 13:57 ata-HGST_HUH721212ALE600_5PKMPLHE-part2 -> ../../sde2
lrwxrwxrwx 1 root root   9 Jun  2 13:57 ata-HGST_HUH721212ALE600_5PKNAGBE -> ../../sda
lrwxrwxrwx 1 root root  10 Jun  2 13:57 ata-HGST_HUH721212ALE600_5PKNAGBE-part1 -> ../../sda1
lrwxrwxrwx 1 root root  10 Jun  2 13:57 ata-HGST_HUH721212ALE600_5PKNAGBE-part2 -> ../../sda2
lrwxrwxrwx 1 root root   9 Jun  2 13:57 ata-HGST_HUH721212ALE600_5PKNPJKB -> ../../sdf
lrwxrwxrwx 1 root root  10 Jun  2 13:57 ata-HGST_HUH721212ALE600_5PKNPJKB-part1 -> ../../sdf1
lrwxrwxrwx 1 root root  10 Jun  2 13:57 ata-HGST_HUH721212ALE600_5PKNPJKB-part2 -> ../../sdf2
lrwxrwxrwx 1 root root   9 Jun  2 13:57 ata-HGST_HUH721212ALE600_5PKPAHME -> ../../sdb
lrwxrwxrwx 1 root root  10 Jun  2 13:57 ata-HGST_HUH721212ALE600_5PKPAHME-part1 -> ../../sdb1
lrwxrwxrwx 1 root root  10 Jun  2 13:57 ata-HGST_HUH721212ALE600_5PKPAHME-part2 -> ../../sdb2
lrwxrwxrwx 1 root root   9 Jun  2 13:57 ata-Micron_1300_MTFDDAK1T0TDL_191521880673 -> ../../sdd
lrwxrwxrwx 1 root root  10 Jun  2 13:57 ata-Micron_1300_MTFDDAK1T0TDL_191521880673-part1 -> ../../sdd1
lrwxrwxrwx 1 root root  10 Jun  2 13:57 ata-Micron_1300_MTFDDAK1T0TDL_191521880673-part2 -> ../../sdd2
lrwxrwxrwx 1 root root  10 Jun  2 13:57 ata-Micron_1300_MTFDDAK1T0TDL_191521880673-part3 -> ../../sdd3
lrwxrwxrwx 1 root root   9 Jun  2 13:57 ata-Micron_1300_MTFDDAK1T0TDL_1915218806F5 -> ../../sdc
lrwxrwxrwx 1 root root  10 Jun  2 13:57 ata-Micron_1300_MTFDDAK1T0TDL_1915218806F5-part1 -> ../../sdc1
lrwxrwxrwx 1 root root  10 Jun  2 13:57 ata-Micron_1300_MTFDDAK1T0TDL_1915218806F5-part2 -> ../../sdc2
lrwxrwxrwx 1 root root  10 Jun  2 13:57 ata-Micron_1300_MTFDDAK1T0TDL_1915218806F5-part3 -> ../../sdc3

I do see some read activity on all drives when looking at iostat:
Code:
root@proxmox:~# iostat
Linux 6.8.12-11-pve (proxmox)   06/02/2025      _x86_64_        (4 CPU)

avg-cpu:  %user   %nice %system %iowait  %steal   %idle
           1.02    0.00    1.02    0.22    0.00   97.73

Device             tps    kB_read/s    kB_wrtn/s    kB_dscd/s    kB_read    kB_wrtn    kB_dscd
sda               0.23         5.91         0.00         0.00       5565          0          0
sdb               0.25         8.29         0.00         0.00       7809          0          0
sdc              20.26        94.91       206.19         0.00      89366     194156          0
sdd              20.08        96.03       206.19         0.00      90422     194156          0
sde               0.23         5.91         0.00         0.00       5565          0          0
sdf               0.23         5.91         0.00         0.00       5565          0          0
zd0               0.24         4.77         0.00         0.00       4495          0          0
zd16              0.06         0.26         0.00         0.00        244          0          0
zd32              0.52        12.72         0.00         0.00      11975          0          0
zd48              0.03         0.12         0.00         0.00        116          0          0

I do not know how to figure out which process is doing the accessing, but I can see that there are SWAP partitions on the drives (automatically created by TrueNAS). Is it possible that the host is using this swap causing the drives/controllers to be blocked for passthrough?

Code:
root@proxmox:~# lsblk -o PATH,TYPE,VENDOR,FSTYPE,PARTLABEL,PARTTYPENAME,MOUNTPOINTS
PATH        TYPE VENDOR   FSTYPE            PARTLABEL        PARTTYPENAME             MOUNTPOINTS
/dev/sda    disk ATA
/dev/sda1   part          linux_raid_member                  Linux swap
/dev/sda2   part          zfs_member                         Solaris /usr & Apple ZFS
/dev/sdb    disk ATA
/dev/sdb1   part          linux_raid_member                  Linux swap
/dev/sdb2   part          zfs_member                         Solaris /usr & Apple ZFS
/dev/sdc    disk ATA
/dev/sdc1   part                                             BIOS boot
/dev/sdc2   part          vfat                               EFI System
/dev/sdc3   part          zfs_member                         Solaris /usr & Apple ZFS
/dev/sdd    disk ATA
/dev/sdd1   part                                             BIOS boot
/dev/sdd2   part          vfat                               EFI System
/dev/sdd3   part          zfs_member                         Solaris /usr & Apple ZFS
/dev/sde    disk ATA
/dev/sde1   part          linux_raid_member                  Linux swap
/dev/sde2   part          zfs_member                         Solaris /usr & Apple ZFS
/dev/sdf    disk ATA
/dev/sdf1   part          linux_raid_member                  Linux swap
/dev/sdf2   part          zfs_member                         Solaris /usr & Apple ZFS
/dev/zd0    disk
/dev/zd0p1  part                                             BIOS boot
/dev/zd0p2  part          vfat                               EFI System
/dev/zd0p3  part          zfs_member                         Solaris /usr & Apple ZFS
/dev/zd16   disk
/dev/zd32   disk
/dev/zd32p1 part          vfat              hassos-boot      EFI System
/dev/zd32p2 part          squashfs          hassos-kernel0   Linux filesystem
/dev/zd32p3 part          erofs             hassos-system0   Linux filesystem
/dev/zd32p4 part          squashfs          hassos-kernel1   Linux filesystem
/dev/zd32p5 part          erofs             hassos-system1   Linux filesystem
/dev/zd32p6 part                            hassos-bootstate Linux filesystem
/dev/zd32p7 part          ext4              hassos-overlay   Linux filesystem
/dev/zd32p8 part          ext4              hassos-data      Linux filesystem
/dev/zd48   disk
 
Last edited:
I tried to rule out some more stuff by creating a new VM, this time with a different system type "i440fx" instead of "q35". When I pass through a PCI device on this machine it shows the same behaviour, hanging on startup. Checking the PCI(e) Passthrough Guide again I have all the right things configured:

Code:
root@proxmox:~# cat /etc/kernel/cmdline
root=ZFS=rpool/ROOT/pve-1 boot=zfs intel_iommu=on
root@proxmox:~# cat /etc/modules
# /etc/modules: kernel modules to load at boot time.
#
# This file contains the names of kernel modules that should be loaded
# at boot time, one per line. Lines beginning with "#" are ignored.
# Parameters can be specified after the module name.
vfio
vfio_iommu_type1
vfio_pci
root@proxmox:~# lsmod | grep vfio
vfio_pci               16384  0
vfio_pci_core          86016  1 vfio_pci
irqbypass              12288  2 vfio_pci_core,kvm
vfio_iommu_type1       49152  0
vfio                   65536  3 vfio_pci_core,vfio_iommu_type1,vfio_pci
iommufd                94208  1 vfio
root@proxmox:~# dmesg | grep -e DMAR -e IOMMU -e AMD-Vi
[    0.009959] ACPI: DMAR 0x000000006D68BD60 0000A8 (v01 INTEL  GLK-SOC  00000003 BRXT 0100000D)
[    0.010034] ACPI: Reserving DMAR table memory at [mem 0x6d68bd60-0x6d68be07]
[    0.115967] DMAR: IOMMU enabled
[    0.383719] DMAR: Host address width 39
[    0.383726] DMAR: DRHD base: 0x000000fed64000 flags: 0x0
[    0.383750] DMAR: dmar0: reg_base_addr fed64000 ver 1:0 cap 1c0000c40660462 ecap 9e2ff0505e
[    0.383763] DMAR: DRHD base: 0x000000fed65000 flags: 0x1
[    0.383778] DMAR: dmar1: reg_base_addr fed65000 ver 1:0 cap d2008c40660462 ecap f050da
[    0.383791] DMAR: RMRR base: 0x0000006d5f3000 end: 0x0000006d612fff
[    0.383799] DMAR: RMRR base: 0x0000006f800000 end: 0x0000007fffffff
[    0.383809] DMAR-IR: IOAPIC id 1 under DRHD base  0xfed65000 IOMMU 1
[    0.383817] DMAR-IR: HPET id 0 under DRHD base 0xfed65000
[    0.383824] DMAR-IR: Queued invalidation will be enabled to support x2apic and Intr-remapping.
[    0.386040] DMAR-IR: Enabled IRQ remapping in x2apic mode
[    0.693867] DMAR: No ATSR found
[    0.693873] DMAR: No SATC found
[    0.693878] DMAR: IOMMU feature fl1gp_support inconsistent
[    0.693880] DMAR: IOMMU feature pgsel_inv inconsistent
[    0.693886] DMAR: IOMMU feature nwfs inconsistent
[    0.693891] DMAR: IOMMU feature eafs inconsistent
[    0.693896] DMAR: IOMMU feature prs inconsistent
[    0.693900] DMAR: IOMMU feature nest inconsistent
[    0.693918] DMAR: IOMMU feature mts inconsistent
[    0.693924] DMAR: IOMMU feature sc_support inconsistent
[    0.693928] DMAR: IOMMU feature dev_iotlb_support inconsistent
[    0.693934] DMAR: dmar0: Using Queued invalidation
[    0.693947] DMAR: dmar1: Using Queued invalidation
[    0.699400] DMAR: Intel(R) Virtualization Technology for Directed I/O
root@proxmox:~# cat /etc/modprobe.d/*
# This file contains a list of modules which are not supported by Proxmox VE

# nvidiafb see bugreport https://bugzilla.proxmox.com/show_bug.cgi?id=701
blacklist nvidiafb
options vfio-pci ids=8086:31e3,1b21:0612
options zfs zfs_arc_max=1638924288

The only difference to the GPU passthrough example is that I cannot blacklist the "ahci" driver because it needs to be used with the boot drives which are not passed through. Maybe as a result of this both controllers still show the "ahci" driver being loaded instead of "vfio-pci":

Code:
root@proxmox:~# lspci -nnk
...
00:12.0 SATA controller [0106]: Intel Corporation Celeron/Pentium Silver Processor SATA Controller [8086:31e3] (rev 03)
        Subsystem: ASRock Incorporation Celeron/Pentium Silver Processor SATA Controller [1849:31e3]
        Kernel driver in use: ahci
        Kernel modules: ahci
...
02:00.0 SATA controller [0106]: JMicron Technology Corp. JMB58x AHCI SATA controller [197b:0585]
        Subsystem: JMicron Technology Corp. JMB58x AHCI SATA controller [197b:0000]
        Kernel driver in use: ahci
        Kernel modules: ahci
...
04:00.0 SATA controller [0106]: ASMedia Technology Inc. ASM1062 Serial ATA Controller [1b21:0612] (rev 02)
        Subsystem: ASRock Incorporation Motherboard [1849:0612]
        Kernel driver in use: ahci
        Kernel modules: ahci

I also tried the vIOMMU options of the q35 machine, but no change there.

Again, I did not actively change anything from when it was working, and now it looks like all vfio passthrough is suddenly broken after an unexpected reboot...
Any help is greatly appreciated.
 
Last edited: