Understanding RAM Usage Statistics in PVE web UI vs. Linux host (e.g. htop)--Odd Readings (But Maybe Normal for ZFS?)

Sep 1, 2022
236
46
33
40
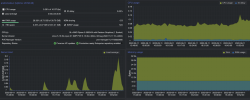
tl;dr: On a ZFS-based system, htop says I'm using 1.74 GiB of 30.8 Gib, with ARC usage statistics being reported that I don't completely understand. PVE's web UI is showing 8.76 GiB of 30.76 GiB. I've defined and started VMs and CTs that each were assigned 1.5-2 GiB, but those are shut down now.

Is this normal? I suspect that it might be, and I'm just not familiar enough with what ZFS ARC looks like when it's working to know how to read what htop is telling me. In which case, I'd guess PVE's web UI is taking that ARC data and doing some kind of calculation to show me what's effectively free memory vs used memory--or rather, what is actually available in a practical sense, and not devoted to ARC.

Is that right? If not, what's going on here?

Here's PVE:
1662933531936.png

Here's htop:
1662933671857.png
 
Last edited:
Is this normal?
Yes, it's harder to differentiate and every program counts a little differently the same data that is displayed to the user. ZFS ARC is indeed more complicated to display. Most tools don't display it at all and just assume it is "used", whereas others show it, as it would be normal with other filesystems/tools as buffer cache, so that to seems "used, but freeable" (buffer seen as free in other systems like windows because it can be used if needed and always displaying 100% used is not good for most users). This is the case for htop. The "really" used stuff is green, whereas the buffer is yellow. On a good system, the goal is that all memory is used as a buffer (yellow), so that it is fast. If you have "really really" free memory, then you have too much memory in your system, but normally this is not going to happen and eventually all memory is used for cache. With ZFS this is also again a little bit more complicated, because the default setting is to use at most 50% of your RAM as ARC, so if you don't run anything else, you will at most use 50% as buffer (if your program shows the ARC as buffer).

Memory is VERY complicated if you go down the rabbit hole and there are a lot of threads in this forum where we peak at the hole. I think that the PVE GUI just takes one step back from tools like free and even simplifies stuff, so that you have just one number to look at. If you step closer than you get free an top and then enter the hole with htop, arcstat and if gets dark very fast.
 

About

The Proxmox community has been around for many years and offers help and support for Proxmox VE, Proxmox Backup Server, and Proxmox Mail Gateway.
We think our community is one of the best thanks to people like you!

Get your subscription!

The Proxmox team works very hard to make sure you are running the best software and getting stable updates and security enhancements, as well as quick enterprise support. Tens of thousands of happy customers have a Proxmox subscription. Get yours easily in our online shop.

Buy now!