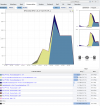
This post could be useful for you if you need to monitor Netflow data. I currently work at NetVizura, but this configuration is vendor-agnostic, so you can set it against any Netflow analyzer.
First we need to install hsflowd package. Depending on your distro(pve5,6,7,etc) , you can install it with:
or if you don’t have that package in your repos you can download latest and install:
https://sflow.net/downloads.php
So let’s say in PVE7:
Then enable the app:
After that we need to configure everything on hsflowd side, editing /etc/hsflowd.conf:
Yes, there is a ovs sflow export, it is really easy to set up https://www.netvizura.com/blog/open-vswitch-netflow-configuration , but if you are not using ovs, then you need to set this up.
IP and port are for your Netflow Analyzer, and pcap { dev = vmbr0 } is your bridge name(it could be named differently so keep that at mind). By default, the hsflowd process collects with sampling rate of 400, but you can set it up differently if you need to.
To check all configuration parameters you can look at /etc/hsflowd.auto:
This should do it for the Netflow configuration. If you need device and interface discovery, don’t forget to install and enable snmp.

First we need to install hsflowd package. Depending on your distro(pve5,6,7,etc) , you can install it with:
Code:
apt install hsflowd –yor if you don’t have that package in your repos you can download latest and install:
https://sflow.net/downloads.php
So let’s say in PVE7:
Code:
wget https://github.com/sflow/host-sflow/releases/download/v2.0.29-7/hsflowd-ubuntu20nvml_2.0.29-7_amd64.deb

dpkg -i hsflowd-ubuntu20nvml_2.0.29-7_amd64.deb
Then enable the app:
Code:
systemctl enable hsflowdAfter that we need to configure everything on hsflowd side, editing /etc/hsflowd.conf:
Code:
sflow {

...

# collectors:

collector { ip=172.16.4.226 udpport=6343 }

...

pcap { dev = vmbr0 }

# Open vSwitch sFlow configuration:

ovs { }

# KVM (libvirt) hypervisor and VM monitoring:

kvm { }

...

}
Yes, there is a ovs sflow export, it is really easy to set up https://www.netvizura.com/blog/open-vswitch-netflow-configuration , but if you are not using ovs, then you need to set this up.
IP and port are for your Netflow Analyzer, and pcap { dev = vmbr0 } is your bridge name(it could be named differently so keep that at mind). By default, the hsflowd process collects with sampling rate of 400, but you can set it up differently if you need to.
To check all configuration parameters you can look at /etc/hsflowd.auto:
Code:
# WARNING: Do not edit this file. It is generated automatically by hsflowd.

rev_start=1

hostname=SPS2

sampling=400

header=128

datagram=1400

polling=30

agentIP=172.16.0.110

agent=vmbr0.701

ds_index=1

collector=172.16.4.226/6343//

rev_end=1
This should do it for the Netflow configuration. If you need device and interface discovery, don’t forget to install and enable snmp.


