Total Cluster Failure

Greatsamps

Active Member
Sep 25, 2017
29
0
41
44
We have just had a serious issue with our cluster.

We have 7 nodes in total, 4 of which are also running Ceph and around 400 VM's running. We were in the process of adding an 8th node, and after adding it to the cluster everything started to lock up.

Upon investigation, it appeared that every single Proxmox node (apart from the new one) had rebooted. Upon reboot, the cluster was not fully up, with loads of errors on the console, only when we disconnected the new node from the network did everything spring back to life.

We then took a closer look at the networking config on node 8. We had made a mistake with the VLAN assignments. Cluster networks 1 + 0 had the wrong VLAN on them, so they would not be able to communicate with the other nodes. Cluster network 2 was correct, and this was the IP address that we used to join the cluster with.

I appreciate that this was an error on our part, but how on earth can a fat finger mistake like this cause the entire cluster to fall on its arse? Surely as the others had a serious majority node 8 would just be marked as offline?

We are in the process of rebuilding node8 and hopefully will be able to join it without issue this time.
 
So tried again, making sure IP addresses/vlans were correct and had exactly the same problem.

I have quite the list of issues with Proxmox now, every single one of which is disrupting my clients by having their VM's randomly going offline.

I am now at a crossroads. Do i shell out several thousand euros on support for the cluster, knowing that the problem may still not get solved? Or go back to Hyper-V which was problem free for many years...

It really worries me that an enterprise product is crashing so much on hardware that ran without any problems for years on Hyper-V/Windows
 
Hi,

A few months back I had the same issue. our whole cluster rebooted while I was trying to add a new node.

We are not using ceph but Hitachi iscsi storage as shared storage with multipathing. I prepared the new node with the same configuration as other cluster nodes (all same model HPE hardware) and added it to the cluster. After a few minutes, all other nodes except the new node rebooted. It took me a few days to fully recover from the failure as some of the database servers are broken. Since we didn't have ceph, recovery was easy and for your case, if it's a hyper-converged cluster with ceph, recovery should be hard I guess


Contacted support and sent logs to them. they found all other nodes fenced due to broken corosync communication between nodes. There was no network disruption at that time and the only thing I can think of, one of the nodes got a slight high load and the systemd maybe failed to restart the corosync properly? even that not explain why all the nodes rebooted(fenced) at the same time.

After a few days of log analysis, they weren't able to find out the exact root cause and suggested me to stop all HA services before adding a new node. And I removed the failed node from the cluster, stop the HA services, and added it back. No reboot after that.

Later we deployed another cluster with ceph and I keep HA disable on that as well. I think there is an option Maintenance Mode in the roadmap but I don't know when they going to implement it. Even with maintenance mode, they should implement some configurable timer how long should watchdog wait before rebooting the nodes or ask from sysadmin first. I know that this fencing is really required when enabling HA on shared storage to prevent damage VM volumes. but the very same option that made for high availability trigger more downtime is unacceptable.

We also had Openstack and esxi on those HPE boxes before. Compared to that crapstack, pve is way better. easy to manage with full of features. But I feel like I can sleep better if those boxes running esxi. (for now).
 
  • Like
Reactions: DerDanilo
Hi,

Thanks for your detailed reply, I am pretty much of the same mindset as you in that something to improve uptime should never behave like this.

We have been running VPS hosting for 11 years, the past 7 of those with Hyper-V, and never had such an issue as this. Windows gets its fair share of people bashing it, but recent versions are very stable. In fact, one of our hosts has not been rebooted (or updated) in 2 years.

I am concerned that even with support subscription and log analysis the root cause was never found for you, I also worry that if there was to be an issue with a switch or something like that, its default reaction is to crash in its entirety.

To put our cluster under just basic support would cost in excess of €10,000 i don't think we can take the risk on this given the steady stream of issues we have faced from day one with this setup.

I think we need to chalk this up as a failed experiment and stick with Hyper-V which has been rock solid stable.
 
Do you use HA ? if you use HA, and all nodes have rebooted, that mean that they have all lost quorum.

what is you cluster network 0,1,2 ? (3 differents corosync rings ?)
(I would like to known if all nodes was talking on 1ring, and the new node with bad vlan sas trying to talk on another ring alone)

what is your package version ?

#pveversion -v

corosync config ? (/etc/pve/corosync.conf)

logs of pve-cluster && corosync at the moment of the crash could be usefull (cat /var/log/daemon|grep ("cluster\|corosync"))
 
Last edited:
When checking the package versions, you should do that on all nodes by compareing the outputs of pveversion -v
Is the 8th node maybe on a newer or older version than the rest of the cluster?
 
Hi,

So the cluster was originally setup by some "consultants" but i have reason to question their abilities.

Every node is identical.

We have a Mellanox 2 port 10GB network card in place, that is configured as an LACP Bond. That then has a single vmbr bridge on it which is VLAN aware.

We then have 3 VLAN interfaces on it:

NET1 - Main Node IP
NET2 - Ceph Cluster
NET3 - Ceph Public

Within the Proxmox Cluster, the links are configured as follows:

Link0 - NET2
Link1 - NET3
Link2 - NET1

At the time of us adding the new node there was a bit more Ceph traffic than normal present as some disks were expanding, but nowhere near saturation of the network. I suspect no more than 300mb/s on a 20gb/s bonded pair.

This is the output of pveversion -v

proxmox-ve: 6.3-1 (running kernel: 5.4.78-2-pve)
pve-manager: 6.3-3 (running version: 6.3-3/eee5f901)
pve-kernel-5.4: 6.3-3
pve-kernel-helper: 6.3-3
pve-kernel-5.4.78-2-pve: 5.4.78-2
pve-kernel-5.4.73-1-pve: 5.4.73-1
pve-kernel-5.4.65-1-pve: 5.4.65-1
pve-kernel-5.4.55-1-pve: 5.4.55-1
pve-kernel-5.4.34-1-pve: 5.4.34-2
ceph: 14.2.15-pve3
ceph-fuse: 14.2.15-pve3
corosync: 3.0.4-pve1
criu: 3.11-3
glusterfs-client: 5.5-3
ifupdown: residual config
ifupdown2: 3.0.0-1+pve3
ksm-control-daemon: 1.3-1
libjs-extjs: 6.0.1-10
libknet1: 1.16-pve1
libproxmox-acme-perl: 1.0.5
libproxmox-backup-qemu0: 1.0.2-1
libpve-access-control: 6.1-3
libpve-apiclient-perl: 3.1-3
libpve-common-perl: 6.3-2
libpve-guest-common-perl: 3.1-3
libpve-http-server-perl: 3.0-6
libpve-storage-perl: 6.3-3
libqb0: 1.0.5-1
libspice-server1: 0.14.2-4~pve6+1
lvm2: 2.03.02-pve4
lxc-pve: 4.0.3-1
lxcfs: 4.0.3-pve3
novnc-pve: 1.1.0-1
proxmox-backup-client: 1.0.5-1
proxmox-mini-journalreader: 1.1-1
proxmox-widget-toolkit: 2.4-3
pve-cluster: 6.2-1
pve-container: 3.3-1
pve-docs: 6.3-1
pve-edk2-firmware: 2.20200531-1
pve-firewall: 4.1-3
pve-firmware: 3.1-3
pve-ha-manager: 3.1-1
pve-i18n: 2.2-2
pve-qemu-kvm: 5.1.0-7
pve-xtermjs: 4.7.0-3
qemu-server: 6.3-2
smartmontools: 7.1-pve2
spiceterm: 3.1-1
vncterm: 1.6-2
zfsutils-linux: 0.8.5-pve1

I have confirmed that versions on the cluster + new node are the same.

This is the output from the corosync.conf:

logging {
debug: off
to_syslog: yes
}

nodelist {
node {
name: ld4-pve-n1
nodeid: 1
quorum_votes: 1
ring0_addr: 172.16.2.21
ring1_addr: 172.16.3.21
ring2_addr: 172.16.1.21
}
node {
name: ld4-pve-n2
nodeid: 2
quorum_votes: 1
ring0_addr: 172.16.2.22
ring1_addr: 172.16.3.22
ring2_addr: 172.16.1.22
}
node {
name: ld4-pve-n3
nodeid: 3
quorum_votes: 1
ring0_addr: 172.16.2.23
ring1_addr: 172.16.3.23
ring2_addr: 172.16.1.23
}
node {
name: ld4-pve-n4
nodeid: 4
quorum_votes: 1
ring0_addr: 172.16.2.24
ring1_addr: 172.16.3.24
ring2_addr: 172.16.1.24
}
node {
name: ld4-pve-n5
nodeid: 5
quorum_votes: 1
ring0_addr: 172.16.2.25
ring1_addr: 172.16.3.25
ring2_addr: 172.16.1.25
}
node {
name: ld4-pve-n6
nodeid: 6
quorum_votes: 1
ring0_addr: 172.16.2.26
ring1_addr: 172.16.3.26
ring2_addr: 172.16.1.26
}
node {
name: ld4-pve-n7
nodeid: 7
quorum_votes: 1
ring0_addr: 172.16.2.27
ring1_addr: 172.16.3.27
ring2_addr: 172.16.1.27
}
node {
name: ln-pve-n8
nodeid: 8
quorum_votes: 1
ring0_addr: 172.16.2.28
ring1_addr: 172.16.3.28
ring2_addr: 172.16.1.28
}
}

quorum {
provider: corosync_votequorum
}

totem {
cluster_name: ld4-cluster1
config_version: 10
interface {
linknumber: 0
}
interface {
linknumber: 1
}
interface {
linknumber: 2
}
ip_version: ipv4-6
link_mode: passive
secauth: on
version: 2
}

FYI Node 8 is the one that caused it to die, its currently still "part" of the cluster but isolated from the network.

This crash happened twice. Once around 14:45 and another around 19:15

What is strange is there is literally nothing in the cluster/corosync logs for the second crash, only the first one. I also don 't have logs on the new node from the first crash as the server was rebuilt inbetween.

Please see log files attached.

Any thoughts would be appreciated :)
 

Attachments

New node pveversion -v

root@ln-pve-n8:~# pveversion -v
proxmox-ve: 6.3-1 (running kernel: 5.4.78-2-pve)
pve-manager: 6.3-3 (running version: 6.3-3/eee5f901)
pve-kernel-5.4: 6.3-3
pve-kernel-helper: 6.3-3
pve-kernel-5.4.78-2-pve: 5.4.78-2
pve-kernel-5.4.73-1-pve: 5.4.73-1
ceph-fuse: 12.2.11+dfsg1-2.1+b1
corosync: 3.0.4-pve1
criu: 3.11-3
glusterfs-client: 5.5-3
ifupdown: residual config
ifupdown2: 3.0.0-1+pve3
ksm-control-daemon: 1.3-1
libjs-extjs: 6.0.1-10
libknet1: 1.16-pve1
libproxmox-acme-perl: 1.0.7
libproxmox-backup-qemu0: 1.0.2-1
libpve-access-control: 6.1-3
libpve-apiclient-perl: 3.1-3
libpve-common-perl: 6.3-2
libpve-guest-common-perl: 3.1-3
libpve-http-server-perl: 3.1-1
libpve-storage-perl: 6.3-3
libqb0: 1.0.5-1
libspice-server1: 0.14.2-4~pve6+1
lvm2: 2.03.02-pve4
lxc-pve: 4.0.3-1
lxcfs: 4.0.3-pve3
novnc-pve: 1.1.0-1
proxmox-backup-client: 1.0.6-1
proxmox-mini-journalreader: 1.1-1
proxmox-widget-toolkit: 2.4-3
pve-cluster: 6.2-1
pve-container: 3.3-2
pve-docs: 6.3-1
pve-edk2-firmware: 2.20200531-1
pve-firewall: 4.1-3
pve-firmware: 3.1-3
pve-ha-manager: 3.1-1
pve-i18n: 2.2-2
pve-qemu-kvm: 5.1.0-7
pve-xtermjs: 4.7.0-3
qemu-server: 6.3-2
smartmontools: 7.1-pve2
spiceterm: 3.1-1
vncterm: 1.6-2
zfsutils-linux: 0.8.5-pve1
 
So, you have 3 corosync rings on same bonded phyiscal nics ?
it's almost useless, as you already have redunduncy with bonding, and if a vlan is saturated (like ceph cluster networks) or if you have latency spike, all other vlans/links will be saturated too or will have problem.
and I really don't known how corosync will handle this, if when trying to failover on other link, it'll have problem too.

Better to have only 1 ring in this case. and maybe, if you have some extra gigabit nic, build a second ring with them.


About your bug, so it's crashed 2 times.
when this occur, vlan was wrong on ring0/1 , but was working on ring2 ?

is other nodes updated to same corosync/pve-cluster version ? (they was a global lock bug in pve-cluster fixed some months ago)
 
Last edited:
  • Like
Reactions: bobmc
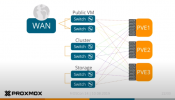
First, in a properly set up, when ha is needed (which I expect when hosting costumers) there should be a seperated interface (better 2 for redundancy) for corosync. When they share, only seperated with vlans, the same links you may be get into troubles with latency. Same problem with ceph.
I think it is sensless using 3 redundant (but not really redundant) links, like this. They are all on the same interface, and in this case absolutly not seperated from each other.

Add1: Here you can see how the network for such an cluster (should) look like:
Proxmox Ceph_small.PNG

Cluster here is not the ceph cluster network. It is the corosync network for the PVE Cluster.
 
Last edited:
Thanks for the replies.

I am starting to realize how it has been setup is madness.

We don't have the resources to dedicate 6 switches to this (2 x public, 2 x cluster, 2 x storage), but we could put the cluster on its own single switch, maybe with a vlan as a backup?

i would not want to be in a position where we had a single switch for the cluster traffic that died and it resulted in the cluster falling on its arse.

in terms of the 2 crashes.

during the first one, there was a vlan mismatch on links 0 + 1, 2 was fine.

during second crash everything was perfect (could ping etc), except there was about 300mb/s of ceph traffic on the network.

If it was due to this though, how come as soon as node 8 is isolated whilst ceph traffic is still going on, the cluster is fine? surely it should have issues all the time..
 
I think 1 really seperated link and another one as backup over vlan or whatever on an other physical link will be much better for the moment.
You can add this link, and when it works out fine (testing before) you can delete the other two (nonsense) links on the bond.
Cluster should be in an fine condition when working on this.
 
Last edited:
To understand it better:

You added the 8th node and there was a problem with your VLAN 0 and 1. (This affected NET2 - Ceph Cluster and NET3 - Ceph Public on all nodes?!)
After fixing this, you added the node again. Ceph tries to recover after restart and this is your main traffic on the bond?
Corosync is very latency sensible. If there is not a physically seperated link for this, other traffic on the network may lead to a latency which is too high for corosync. In your case corosync tries to change his link for finding a better one, but it will not find a better one because all three links have an too high latency (because of the same physical link).
Maybe with 7 nodes the latency, even with traffic on the network, was low enought for corosync. Otherwiese, you would have seen problems earlier, and we would discuss about problems adding the 6th or 7th node.. (Have you ever testet the latancy on the corosync connection?) Corosync come into trouble when the latency on the network is higher than 6-7ms.
I think, if all other things were done correct, the ceph traffic lead to the problem on the secound try. (ceph traffic + 8th node was too much)
Never the less the root of the problem is not the traffic, it is the wrong network structure for the cluster.
 
Last edited:
I have been taking a look at this in more depth, and i am starting to wonder if there is an issue with the overall network setup

there are a lot of of corosync entries such as this:

Jan 1 10:12:59 ld4-pve-n6 corosync[2200]: [KNET ] link: host: 3 link: 2 is down
Jan 1 10:12:59 ld4-pve-n6 corosync[2200]: [KNET ] host: host: 3 (passive) best link: 0 (pri: 1)
Jan 1 10:13:02 ld4-pve-n6 corosync[2200]: [KNET ] rx: host: 3 link: 2 is up
Jan 1 10:13:02 ld4-pve-n6 corosync[2200]: [KNET ] host: host: 3 (passive) best link: 0 (pri: 1)
Jan 1 10:13:45 ld4-pve-n6 corosync[2200]: [TOTEM ] Retransmit List: e901d2
Jan 1 10:16:01 ld4-pve-n6 corosync[2200]: [TOTEM ] Retransmit List: e90b32
Jan 1 10:16:55 ld4-pve-n6 corosync[2200]: [TOTEM ] Retransmit List: e90ed2
Jan 1 10:17:45 ld4-pve-n6 corosync[2200]: [TOTEM ] Retransmit List: e91237
Jan 1 10:18:10 ld4-pve-n6 corosync[2200]: [TOTEM ] Retransmit List: e913e1
Jan 1 10:20:05 ld4-pve-n6 corosync[2200]: [TOTEM ] Retransmit List: e91bd1
Jan 1 10:21:05 ld4-pve-n6 corosync[2200]: [TOTEM ] Retransmit List: e91fda
Jan 1 10:21:28 ld4-pve-n6 corosync[2200]: [TOTEM ] Retransmit List: e92164
Jan 1 10:27:56 ld4-pve-n6 corosync[2200]: [TOTEM ] Retransmit List: e93b91
Jan 1 10:28:05 ld4-pve-n6 corosync[2200]: [TOTEM ] Retransmit List: e93c50
Jan 1 10:28:25 ld4-pve-n6 corosync[2200]: [TOTEM ] Retransmit List: e93db2
Jan 1 10:28:35 ld4-pve-n6 corosync[2200]: [TOTEM ] Retransmit List: e93e64
Jan 1 10:29:46 ld4-pve-n6 corosync[2200]: [KNET ] link: host: 3 link: 2 is down
Jan 1 10:29:46 ld4-pve-n6 corosync[2200]: [KNET ] host: host: 3 (passive) best link: 0 (pri: 1)
Jan 1 10:29:48 ld4-pve-n6 corosync[2200]: [KNET ] rx: host: 3 link: 2 is up
Jan 1 10:29:48 ld4-pve-n6 corosync[2200]: [KNET ] host: host: 3 (passive) best link: 0 (pri: 1)

then we also have a lot of syslog messages such as this:

Jan 1 19:15:55 ld4-pve-n6 kernel: [15918.035539] libceph: osd6 (1)172.16.3.23:6803 socket closed (con state OPEN)
Jan 1 19:15:58 ld4-pve-n6 kernel: [15920.709455] libceph: osd10 (1)172.16.3.22:6811 socket closed (con state OPEN)
Jan 1 19:15:58 ld4-pve-n6 kernel: [15921.164725] libceph: osd5 (1)172.16.3.22:6807 socket closed (con state OPEN)
Jan 1 19:15:59 ld4-pve-n6 kernel: [15921.938720] libceph: osd1 (1)172.16.3.21:6815 socket closed (con state OPEN)
Jan 1 19:15:59 ld4-pve-n6 kernel: [15921.938765] libceph: osd2 (1)172.16.3.22:6803 socket closed (con state OPEN)
Jan 1 19:16:07 ld4-pve-n6 kernel: [15929.806832] libceph: osd10 (1)172.16.3.22:6811 socket closed (con state OPEN)
Jan 1 19:16:21 ld4-pve-n6 kernel: [15943.774451] libceph: osd6 (1)172.16.3.23:6803 socket closed (con state OPEN)
Jan 1 19:16:23 ld4-pve-n6 kernel: [15945.774849] libceph: osd5 (1)172.16.3.22:6807 socket closed (con state OPEN)
Jan 1 19:16:28 ld4-pve-n6 kernel: [15951.441484] libceph: osd5 (1)172.16.3.22:6807 socket closed (con state OPEN)
Jan 1 19:16:47 ld4-pve-n6 kernel: [15969.647010] libceph: osd6 (1)172.16.3.23:6803 socket closed (con state OPEN)
Jan 1 19:16:49 ld4-pve-n6 kernel: [15972.468027] libceph: osd10 (1)172.16.3.22:6811 socket closed (con state OPEN)
Jan 1 19:16:49 ld4-pve-n6 kernel: [15972.505702] libceph: osd5 (1)172.16.3.22:6807 socket closed (con state OPEN)
Jan 1 19:16:50 ld4-pve-n6 kernel: [15973.102387] libceph: osd2 (1)172.16.3.22:6803 socket closed (con state OPEN)
Jan 1 19:16:50 ld4-pve-n6 kernel: [15973.484391] libceph: osd10 (1)172.16.3.22:6811 socket closed (con state OPEN)
Jan 1 19:17:20 ld4-pve-n6 kernel: [16003.445008] libceph: osd10 (1)172.16.3.22:6811 socket error on write

i have had some bad experiences in the past with Linux bonding, but i had assumed/hoped that by going full-blown switch-powered bonding with LACP this would be resolved... maybe not.

Just to clarify here, the links are absolutely not saturated from a data perspective. Both are 10Gb/s, the switch is doing hardly anything, the storage data would be 450mb/s tops and the public VM traffic for everything is less than 100mb/s

Would it perhaps be better to break the bond, and put storage on 1 port, vm traffic on the other, and corosync on seperate 1gb link?

Issue here though is if we lose either of the 2 switches everything dies

I do also know perhaps why node 8 has been causing issues.

We have the MTU set to 9000 on everything i the cluster. On Node8 it was still set to 1500, perhaps this mismatch was enough to slow down the cluster traffic on everything to the point it died...?
 
Last edited:
What I've learned the hardway with proxmox server that the timesync is key to run everything smooth. If i add a offskew server every thing starts to run wonky.
 
Ok, so an update for you.

I have changed the primary corosyn interface over to a standalone 1gb one. For now it is still on the same switch as that will require a DC visit to change, but figured it would be better off like this.

For a start, the retransmit messages have stopped, and there is nothing in the corosync logs about that network being down, however it is still complaining about the bonded one, although i have set a low priority on that so its not used.

I decided to bit the bullet and have another go at adding this cursed node... 3rd time was the charm and its now added.

I am however really concerned about the network on that bonded pair. We are getting a lot of messages such as the ones below:

Jan 2 16:46:44 ld4-pve-n3 corosync[2809]: [KNET ] link: host: 6 link: 1 is down
Jan 2 16:46:44 ld4-pve-n3 corosync[2809]: [KNET ] host: host: 6 (passive) best link: 2 (pri: 10)
Jan 2 16:46:45 ld4-pve-n3 corosync[2809]: [KNET ] rx: host: 6 link: 1 is up
Jan 2 16:46:45 ld4-pve-n3 corosync[2809]: [KNET ] host: host: 6 (passive) best link: 2 (pri: 10)

Jan 2 16:48:50 ld4-pve-n3 kernel: [77117.841426] libceph: osd1 (1)172.16.3.21:6803 socket closed (con state OPEN)

Jan 2 16:48:18 ld4-pve-n3 corosync[2809]: [KNET ] pmtud: possible MTU misconfiguration detected. kernel is reporting MTU: 8988 bytes for host 6 link 1 but the other node is not acknowledging packets of this size.
Jan 2 16:48:18 ld4-pve-n3 corosync[2809]: [KNET ] pmtud: This can be caused by this node interface MTU too big or a network device that does not support or has been misconfigured to manage MTU of this size, or packet loss. knet will continue to run but performances might be affected.

With regards to this last one, i have confirmed that the following is set to 9000 MTU:

Ports
Bond
Bridge
Vlan Interface

With regards to ceph, there are lots of those, not hundreds, but a steady stream.

I am wondering if those ports are flapping...

In addition when the new nodes startup there are a few of these errors:

mlx5_core 0000:82:00.0: cmd_work_handler:877:(pid): failed to allocate command entry

I am interested in this as mlx5_core relates to the Mellanox network card...

I have another thread open about servers randomly completely locking up to the point you can't even type on the console, my gut tells me this is something to do with the network, and todays discoveries are only fueling this concern.

How can i give this part of the network a decent health check?
 
Just to clarify here, the links are absolutely not saturated from a data perspective. Both are 10Gb/s, the switch is doing hardly anything, the storage data would be 450mb/s tops and the public VM traffic for everything is less than 100mb/s

Even if not saturated, traffic on the network will rise the latency. If it works out and you can go fine with that, leave it. But it is always highly recomanded to split the links.

We have the MTU set to 9000 on everything i the cluster. On Node8 it was still set to 1500, perhaps this mismatch was enough to slow down the cluster traffic on everything to the point it died...?
MTU is absolutely relevant. They have to set up everywhere with the same MTU value.

What I've learned the hardway with proxmox server that the timesync is key to run everything smooth

Requirements:
  • All nodes must be able to connect to each other via UDP ports 5404 and 5405 for corosync to work.
  • Date and time have to be synchronized.
  • SSH tunnel on TCP port 22 between nodes is used.
  • If you are interested in High Availability, you need to have at least three nodes for reliable quorum. All nodes should have the same version.
  • We recommend a dedicated NIC for the cluster traffic, especially if you use shared storage.
  • Root password of a cluster node is required for adding nodes.
https://pve.proxmox.com/wiki/Cluster_Manager
 
So running iperf things look ok:

root@ld4-pve-n2:~# iperf -c 172.16.2.21
------------------------------------------------------------
Client connecting to 172.16.2.21, TCP port 5001
TCP window size: 325 KByte (default)
------------------------------------------------------------
[ 3] local 172.16.2.22 port 59694 connected with 172.16.2.21 port 5001
[ ID] Interval Transfer Bandwidth
[ 3] 0.0-10.0 sec 11.5 GBytes 9.88 Gbits/sec

i think latest version of corosync does not use multicast any longer?

Perhpas i should start a new thread about the ceph disconnections etc.
 
Concerning omping:

Beware if you are already experiencing issues, the steps taken to diagnose the problem may make the problem worse in the short term!
You have to install omping on all the machines, you want to test.
Then you have to fire up
omping -c 10000 -i 0.001 -F -q node1 node2 node3 nodeX
on all the nodes listed (node1, node2, node3, nodeX) on the same time, otherwise there could not be any response.
In your case start it (best at the same time, via ssh) on node1, node2, node3, .. , nodeX. If you start it one after another through the gui (some seconds in between) there may be some packages which will be lost. (but that is not a problem)
You are totally right, when saying that corosync works at this version with unicast. You will also get an unicast result from omping.
If you are testing with this procedure you can simulate what is going on in the normal case. All your cluster nodes are fireing there signals.

E.g. results of a three node cluster

192.168.252.49 : unicast, xmt/rcv/%loss = 10000/10000/0%, min/avg/max/std-dev = 0.012/0.045/0.352/0.023

192.168.252.49 : multicast, xmt/rcv/%loss = 10000/9999/0% (seq>=2 0%), min/avg/max/std-dev = 0.014/0.049/0.395/0.024

192.168.252.50 : unicast, xmt/rcv/%loss = 10000/9995/0%, min/avg/max/std-dev = 0.011/0.045/0.358/0.029

192.168.252.50 : multicast, xmt/rcv/%loss = 10000/9994/0% (seq>=2 0%), min/avg/max/std-dev = 0.014/0.049/0.367/0.029

here you can see the min/avg/max latency in unicast.

You will get a result from every node on wich you have started omping.

If there are many nodes in contact with each other latancy may become higher and corosync comes into trouble. As written latancy should be under 6-7ms when all nodes are pinging.

This is a short term test. If you are running
omping -c 600 -i 1 -q node1 node2 node3 nodeX
you get a result over a period of about 10 minutes. Then you will also see the impact of the other traffic runing over your interface.

Both should work with a latency unter 6-7ms to ensure that corosync can work properly from the network side. (look at max)
 

About

The Proxmox community has been around for many years and offers help and support for Proxmox VE, Proxmox Backup Server, and Proxmox Mail Gateway.
We think our community is one of the best thanks to people like you!

Get your subscription!

The Proxmox team works very hard to make sure you are running the best software and getting stable updates and security enhancements, as well as quick enterprise support. Tens of thousands of happy customers have a Proxmox subscription. Get yours easily in our online shop.

Buy now!