Hello!
Need help.
Test System: proxmox 4.4, ceph + cephFS jewel.
proxmox-ve: 4.4-84 (running kernel: 4.4.44-1-pve)
pve-manager: 4.4-13 (running version: 4.4-13/7ea56165)
pve-kernel-4.4.35-1-pve: 4.4.35-77
pve-kernel-4.4.44-1-pve: 4.4.44-84
lvm2: 2.02.116-pve3 corosync-pve: 2.4.2-2~pve4+1
libqb0: 1.0-1
pve-cluster: 4.0-48
qemu-server: 4.0-109
pve-firmware: 1.1-10
libpve-common-perl: 4.0-94
libpve-access-control: 4.0-23
libpve-storage-perl: 4.0-76
pve-libspice-server1: 0.12.8-2
vncterm: 1.3-1
pve-docs: 4.4-3
pve-qemu-kvm: 2.7.1-4
pve-container: 1.0-96
pve-firewall: 2.0-33
pve-ha-manager: 1.0-40
ksm-control-daemon: 1.2-1
glusterfs-client: 3.5.2-2+deb8u3
lxc-pve: 2.0.7-4 lxcfs: 2.0.6-pve1
criu: 1.6.0-1 novnc-pve: 0.5-9
smartmontools: 6.5+svn4324-1~pve80
zfsutils: 0.6.5.9-pve15~bpo80
ceph: 10.2.6-1~bpo80+1
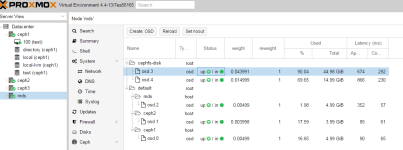
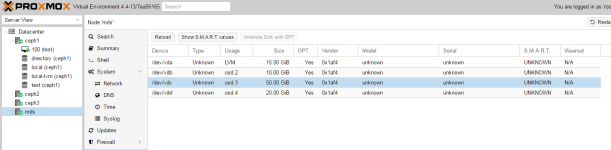
There is osd.3 = 50GB -5Gb log = 45GB, it uses only the cephfs-data pool according to the crush map.
Root cephfs-disk {
Id -5 # do not change unnecessarily
# Weight 0.059
Alg straw
Hash 0 # rjenkins1
Item osd.3 weight 0.044
Rule cephfs-pool {
Ruleset 1
Type replicated
Min_size 1
Max_size 10
Step take cephfs-disk
Step chooseleaf firstn 0 type osd
Step emit
I intentionally scored the entire disk with cephfs via dd. And I see the following picture:
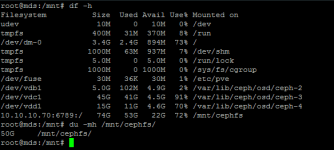
In the system, the output du
Du -mh /mnt/cephfs
50G cephfs
f I look through the web OSD snap then the data is correct:
It is occupied 90%
Volume 45GB
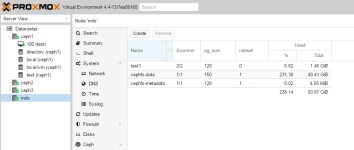
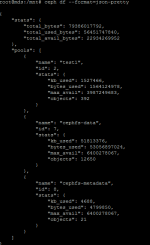
If I look in the pool section, I see the following:
231% are occupied
Volume of 49.4Gb
What is this percentage? Why is not it 100%?
Need help.
Test System: proxmox 4.4, ceph + cephFS jewel.
proxmox-ve: 4.4-84 (running kernel: 4.4.44-1-pve)
pve-manager: 4.4-13 (running version: 4.4-13/7ea56165)
pve-kernel-4.4.35-1-pve: 4.4.35-77
pve-kernel-4.4.44-1-pve: 4.4.44-84
lvm2: 2.02.116-pve3 corosync-pve: 2.4.2-2~pve4+1
libqb0: 1.0-1
pve-cluster: 4.0-48
qemu-server: 4.0-109
pve-firmware: 1.1-10
libpve-common-perl: 4.0-94
libpve-access-control: 4.0-23
libpve-storage-perl: 4.0-76
pve-libspice-server1: 0.12.8-2
vncterm: 1.3-1
pve-docs: 4.4-3
pve-qemu-kvm: 2.7.1-4
pve-container: 1.0-96
pve-firewall: 2.0-33
pve-ha-manager: 1.0-40
ksm-control-daemon: 1.2-1
glusterfs-client: 3.5.2-2+deb8u3
lxc-pve: 2.0.7-4 lxcfs: 2.0.6-pve1
criu: 1.6.0-1 novnc-pve: 0.5-9
smartmontools: 6.5+svn4324-1~pve80
zfsutils: 0.6.5.9-pve15~bpo80
ceph: 10.2.6-1~bpo80+1
There is osd.3 = 50GB -5Gb log = 45GB, it uses only the cephfs-data pool according to the crush map.
Root cephfs-disk {
Id -5 # do not change unnecessarily
# Weight 0.059
Alg straw
Hash 0 # rjenkins1
Item osd.3 weight 0.044
Rule cephfs-pool {
Ruleset 1
Type replicated
Min_size 1
Max_size 10
Step take cephfs-disk
Step chooseleaf firstn 0 type osd
Step emit
I intentionally scored the entire disk with cephfs via dd. And I see the following picture:
In the system, the output du
Du -mh /mnt/cephfs
50G cephfs
f I look through the web OSD snap then the data is correct:
It is occupied 90%
Volume 45GB
If I look in the pool section, I see the following:
231% are occupied
Volume of 49.4Gb
What is this percentage? Why is not it 100%?
Last edited:
")